
Quality of western Canadian canola 2018
Fatty acid composition
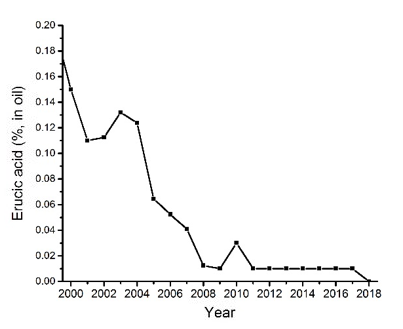
The average level of erucic acid in the 2018 crop was 0.00% (below limit of quantification), which is very similar to what was observed for the last 5 years (0.01%) (Tables 1, 5, Figure 12). Similar to the total glucosinolate content, these low values are a direct result of breeding efforts of the Canadian canola industry.
For Canola, No.1 Canada samples, mean α-linolenic acid (C18:3) was 8.7%, which is almost one point lower than 2017 (9.5%) and the 5 year (9.4%) averages (Table 1, Figure 13). This year, samples from Manitoba and Saskatchewan had α-linolenic acid averages much lower than the samples from Alberta-Peace River - 8.6, 8.5 and 9.0%, respectively (Table 5). The total content of poly-unsaturated fatty acids or PUFA were 27.1 (28.4% in 2017), 26.8 (28.4% in 2017) and 27.5% (28.5% in 2017) in Manitoba, Saskatchewan and Alberta-Peace River, respectively, for a western Canada average of 27.3% (28.5% in 2017). For canola, the PUFA contents are directly related to the contents α-linolenic acid (C18:3) and linoleic acid (C18:2). This year, the ratio omega-6/omega-3 (linoleic acid/α-linolenic acid) was 2.12 significantly higher than the 1.94 observed in 2017.
The fatty acid composition (oleic acid, linoleic acid and α-linolenic acid) of the 2018 crop presented a very different composition when compared to the 2017 fatty acid composition (+1.3%, +0.5% and -0.9% for oleic, linoleic and linolenic fatty acid contents). As a result, the iodine value which is a representation of the total unsaturation on the oil is very different in 2018 when compare to 2017. The 2018 iodine value averaged 111.0 units, 2.1 points lower than the 2017 iodine value average (113.1 units) and 1.6 units lower than the 5-year average (112.6 units) (Table 1, Figure 16). For Canola, No. 1 Canada, the iodine value averages were 110.9 (112.8 units in 2017), 110.6 (113.1 units in 2017) and 111.7 units (113.3 units in 2017) for Manitoba, Saskatchewan and Alberta-Peace River, respectively (Table 5). This year, iodine value of individual samples of Canola, No.1 Canada samples ranged from 103.2 to 122.0 units.
Samples graded Canola, No. 2 Canada showed higher iodine value averages, with higher linoleic and α-linolenic acid contents and lower oleic acid contents that the samples Canola, No. 1 Canada (Table 5).
Average of saturated fatty acid content was 6.7% in 2018, slightly higher than the 2017 average (6.5%) and identical to the 5-year average (6.7%) (Tables 1 and 5). Since 2009, the saturated fatty acid content averages varied from 6.6 - 6.9% (Table 1, Figure 17). In 2018, the saturated fatty acid content averages were similar for the 3 provinces, (6.6, 6.7 and 6.6% for Manitoba, Saskatchewan and Alberta-Peace River, respectively). Total saturated fatty acids are usually affected by temperature, high temperatures lead to higher oil saturation.
As all quality parameters, the fatty acid composition is greatly affected by variety and/or environment, however over the last couples of years, a lot of effort has been made to control the total saturates content of the oil in order to produce a healthy oil - the oil with the lowest total saturates content compared to all other vegetable oils. As a result, total saturates content has been very stable since 2009 but all other fatty acid contents – except erucic acid – can move around. This year, for individual samples of Canola, No.1 Canada, oleic acid, linoleic acid and α-linolenic acid ranged from 55.2 to 69.4%, 14.6 to 23.7% and 5.4 to 12.5%, respectively. Samples from southern Alberta-Peace River (crop districts 1, 2, and 3) had a very different fatty acid composition than samples from the north of Alberta - Peace River (crop districts 5, 6 and 7), the hot and dry conditions in the south led to samples with less total unsaturation (more MUFA and less PUFA) when compare to samples grown in the north (more PUFA and less MUFA).
Environment alone is not responsible for the 2018 different fatty acid composition when compared to 2017 averages, variety (genetic) also played an effect. The varieties distribution in the 2018 survey was compared to the 2018 variety insured acreages reported by the Statistics Unit of the Canadian Grain Commission. The main varieties in our harvest survey were L233P at 17.3% (24.0% of insured acres), L252 at 11.8% (13% of insured acres) and L230 at 5.3% (6% insured acres), whereas last year the main three varieties were L252 (13% in the 2017 harvest, 16.1% 2017 insured acres), L140P (10.8% in the 2017 harvest, 12.9% 2017 insured acres) and L233P (4.2% in the 2017 harvest, 5.4% 2017 insured acres). The variety L233P showed the lowest α-linolenic acid contents (8.1% in Manitoba, 7.8% in Saskatchewan & 8.0% in Alberta) and the highest oleic acid contents (65.4% in Manitoba, 66.2% in Saskatchewan and 65.9% in Alberta) when compared to L252 (9.1 & 62.6% in Manitoba, 9.2 & 62.9% in Saskatchewan and 9.6 & 62.6% in Alberta, for α-linolenic acid and oleic acid, respectively) and L230P (9.3 & 63.0% in Manitoba, 9.3 & 62.9% in Saskatchewan and 10.1 & 62.3% in Alberta, for α-linolenic acid and oleic acid, respectively).
Long-term averages, as presented in Figures 15, 16 and 17 (2000-2018), also showed an important continuous change in the fatty acid composition of Canadian Canola. These long-term changes are a direct result from breeding targets. To fulfill the definition of a low saturated oil, canola oil needs to contain less than 7% total saturated fatty acid. This means that companies need to select seeds that have total saturated lower than 7.0% over different climates and geographic locations. This selection pressure has an effect on the other fatty acid contents, as the only method to maintain low total saturates is to increase unsaturation. In canola oil there are two types of unsaturation, the monounsaturated fatty acids (MUFA) and the polyunsaturated fatty acids (PUFA), since there is no breeding pressure on the MUFA or PUFA contents, they can vary greatly from one variety to the other. However, unsaturation for Brassica napus, the canola species grown right now in Canada means more oleic acid, a MUFA than PUFAs being α-linolenic acid (omega 3, PUFA) or linoleic acid (omega-6, PUFA), leading to the trends seen in Figures 15, 16 and 17.
The different fatty acid composition of the 2018 harvest was reflected with the different fatty acid composition of the first 5 months exports of the 2018-19 shipping season (Table 6). Oleic acid and α-linolenic acid averages, as well as the resulting iodine value averages, of commercially clean exports were different at the beginning of the shipping season compare to the 2018 December exports and last year shipping season. September and October export averages where 8.6 and 8.4%, and 64.3 and 64.7% for α-linolenic acid and oleic acid averages (iodine value averages were 110.8 and 110.3 units) as exports were mainly constituted of early harvest canola from the southern part of Alberta. November and December exports averages increased for α-linolenic acid and decreased for oleic acid as more canola crop from the northern part of Alberta-Peace River was incorporated to the exports.
The level of saturated fatty acids until December 2018 canola (6.6%) exports remained very similar to 2017 18 means (6.6%). It is expected that levels of erucic acid will remain very low for the new shipping season (below 0.1%) since erucic acid contents were very low in the 2018 harvest.
Figure 12 Canola, No. 1 Canada, erucic acid content of harvest samples, 2000 to 2018
-
Details
Erucic acid content (% in oil), 2000 to 2017 Year Erucic acid content (% in oil) 2018 0 2017 0.01 2016 0.01 2015 0.01 2014 0.01 2013 0.01 2012 0.01 2011 0.01 2010 0.03 2009 0.01 2008 0.01 2007 0.04 2006 0.05 2005 0.06 2004 0.12 2003 0.13 2002 0.11 2001 0.11 2000 0.15
Figure 13 Canola, No. 1 Canada, α-linolenic acid content of harvest samples, 2000 to 2018

-
Details
α-linolenic acid content (% in oil), 2000 to 2017 Year α-linolenic acid content
(% in oil)2018 8.6 2017 9.5 2016 9.6 2015 9.7 2014 9.2 2013 9.1 2012 9.6 2011 9.9 2010 10.4 2009 9.8 2008 9.1 2007 9.8 2006 9.9 2005 11.1 2004 11.2 2003 8.4 2002 10.6 2001 9.4 2000 9.9
Figure 14 Canola, No. 1 Canada, oleic acid content of harvest samples, 2000 to 2018

-
Details
Oleic acid content (% in oil), 2000 to 2017 Year Oleic acid content (% in oil) 2018 64.5 2017 63.0 2017 63.0 2016 62.6 2015 62.6 2014 62.9 2013 63.4 2012 62.5 2011 62.0 2010 62.3 2009 62.3 2008 63.2 2007 61.5 2006 62.1 2005 59.8 2004 58.9 2003 63.2 2002 60.6 2001 61.9 2000 61.5
Figure 15 Canola, No. 1 Canada, linoleic acid content of harvest samples, 2000 to 2018

-
Details
Linoleic acid content (% in oil), 2000 to 2017 Year Linoleic acid content (% in oil) 2018 18.3 2017 18.8 2016 18.9 2015 18.8 2014 18.9 2013 18.5 2012 19.2 2011 19.1 2010 18.9 2009 18.8 2008 18.5 2007 19.3 2006 18.9 2005 19.7 2004 20.3 2003 18.5 2002 19.1 2001 19.1 2000 19.1
Figure 16 Canola, No. 1 Canada, iodine value of harvest samples, 2000 to 2018

-
Details
Iodine value (units in oil), 2000 to 2017 Year Iodine value (units in oil) 2018 111.1 2017 113.1 2016 113.1 2015 113.1 2014 112.3 2013 111.8 2012 113.3 2011 113.6 2010 115.0 2009 114.0 2008 111.5 2007 113.3 2006 113.4 2005 116.1 2004 117.0 2003 110.1 2002 114.7 2001 112.4 2000 114.0
Figure 17 Canola, No. 1 Canada, Total saturated fatty acid content of harvest samples, 2000 to 2018

-
Details
Total saturated fatty acid content (% in oil) Year Total Saturated fatty acid content (% in oil) 2018 6.67 2017 6.53 2016 6.74 2015 6.65 2014 6.74 2013 6.80 2012 6.58 2011 6.80 2010 6.85 2009 6.85 2008 7.09 2007 6.98 2006 6.98 2005 6.96 2004 6.96 2003 7.26 2002 7.03 2001 7.20 2000 7.09
| Relative fatty acid composition of the oil, % | Total saturatesFootnote3, % | Iodine valueFootnote4, units | |||||
|---|---|---|---|---|---|---|---|
| C18:0 | C18:1 | C18:2 | C18:3 | C22:1 | |||
| Canola, No. 1 Canada | |||||||
| Manitoba | 1.8 | 64.2 | 18.5 | 8.6 | 0.00 | 6.6 | 110.9 |
| Saskatchewan | 1.7 | 64.5 | 18.2 | 8.5 | 0.00 | 6.7 | 110.7 |
| Alberta-Peace RiverFootnote1 | 1.7 | 63.7 | 18.4 | 9.0 | 0.00 | 6.7 | 111.7 |
| Western CanadaFootnote2 | 1.7 | 64.3 | 18.3 | 8.7 | 0.00 | 6.7 | 111.0 |
| Canola, No. 2 Canada | |||||||
| Manitoba | 1.7 | 62.2 | 19.0 | 9.5 | 0.02 | 6.7 | 112.7 |
| Saskatchewan | 1.6 | 61.1 | 19.3 | 10.7 | 0.00 | 6.6 | 115.3 |
| Alberta-Peace RiverFootnote1 | 1.5 | 61.2 | 19.4 | 10.6 | 0.00 | 6.5 | 115.3 |
| Western CanadaFootnote2 | 1.5 | 61.2 | 19.3 | 10.6 | 0.00 | 6.6 | 116.5 |
| Canola, No. 3 Canada | |||||||
| Manitoba | 1.6 | 60.5 | 19.6 | 10.6 | 0.02 | 6.8 | 115.1 |
| Saskatchewan | 1.5 | 59.7 | 19.8 | 11.2 | 0.02 | 6.7 | 116.4 |
| Alberta-Peace RiverFootnote1 | 1.5 | 59.7 | 20.1 | 11.1 | 0.00 | 6.6 | 116.5 |
| Western CanadaFootnote2 | 1.5 | 59.7 | 20.0 | 11.1 | 0.01 | 6.6 | 116.5 |
| Canola, Sample Canada | |||||||
| Manitoba | 1.8 | 60.0 | 20.0 | 9.7 | 0.00 | 7.1 | 113.0 |
| Saskatchewan | 1.4 | 67.7 | 20.8 | 11.4 | 0.23 | 6.9 | 117.2 |
| Alberta-Peace RiverFootnote1 | 1.5 | 58.4 | 20.6 | 10.9 | 0.04 | 6.9 | 116.3 |
| Western CanadaFootnote2 | 1.6 | 58.9 | 20.4 | 10.5 | 0.06 | 7.0 | 115.2 |
"Page details"
- Date modified: