
Barley Production, Barley Nutrient Content, and Quality of Malting Barley in Western Canada 2020
Nutritional components in barley grain
Barley is a versatile crop that can be used for animal feed, human food, the production of malt and beer, and forage. Selective breeding practices in recent decades have resulted in the development of barley genotypes with distinctive traits targeted for specific end uses. Examples of such traits include the ability to produce ample amounts of hydrolytic enzymes needed for malting or a high content of soluble fibre in grain to combat heart disease. In Canada, barley varieties are classified into three major types based on their intended end use: food, general purpose, and malting barley. Even though nutrient levels in barley are controlled by genotype, environmental growing conditions, and the interactions between these two factors, barley is generally a wholesome and nutritious cereal grain. Many health benefits are derived from its high levels of soluble β-glucans, total dietary fibre, tocols, vitamin B, and phenolic compounds. While specialty food barley can deliver exceptionally high levels of β-glucan and starch with altered characteristics (waxy or high amylose), any type of barley can be made into convenient food ingredients such as pearled grain, steel-cut, flakes and flour. Barley can also be blended into various food products to add texture, flavor, and nutritional value to the product. As a food grain, however, barley is still awaiting greater utilization by the food industry and better recognition and acceptance by consumers.
In 2020, we began an analysis of the nutritional components in barley in order to obtain a better understanding of the nutrient levels in various genotypes and barley classes. Covered barley genotypes were dehulled to determine the level of nutrients in the edible portion of the grain. Since the hull is firmly attached to the caryopsis it is usually difficult to remove and some parts of the outer layer, such as the pericarp or testa, may be unintentionally lost during the dehulling process. In hulless barley genotypes, the dry hulls are easily detached from the rest of the kernel during combining at harvest. Hulless barley may contain remnants of adhering hulls, however, and these also need to be removed mechanically before the grain is suitable for consumption. For comparison purposes we are reporting the level of nutrients before and after dehulling. The values for malting varieties represent averages for samples grown in two different locations in 2020. Other varieties were grown in a single location. Specialty food barley includes hulless, high β-glucan varieties with waxy (CDC Fibar, CDC Marlina, CDC Valdres) or high amylose starch (CDC Hilose).
Figure 3.1 (a) Content of proteins in various genotypes of specialty food (hulless), food/general purpose, and malting barley before and after dehulling. The values for malting varieties represent averages for samples grown in two different locations.
.png)
-
Details
Protein (%, db) covered barley (unhulled) barley after dehulling Class Variety Protein (%,db) SD* Protein (%,db) SD* Specialty Food (Hulless) CDC Fibar 14.98 CDC Hilose 13.05 CDC Marlina 13.33 CDC Valdres 15.32 Food/General Purpose Canmore 12.80 12.42 CDC Austenson 11.63 11.53 Champion 11.52 11.46 Brahma 11.65 11.30 AB Wrangler 12.75 12.02 Malting AC Metcalfe 11.94 1.18 11.86 1.24 CDC Copeland 11.39 0.68 11.21 0.95 AAC Synergy 11.19 0.96 11.10 0.97 AAC Connect 12.49 0.74 12.42 0.64 CDC Bow 11.59 11.38 CDC Fraser 11.73 1.20 11.58 1.06 *SD = standard deviation
Figure 3.1 (b) Content of ash in various genotypes of specialty food (hulless), food/general purpose, and malting barley before and after dehulling. The values for malting varieties represent averages for samples grown in two different locations.
.png)
-
Details
Ash (%, db) covered barley (unhulled) barley after dehulling Class Variety Ash (%,db) SD* Ash (%,db) SD* Specialty Food (Hulless) CDC Fibar 2.10 CDC Hilose 1.84 CDC Marlina 1.60 CDC Valdres 1.84 Food/General Purpose Canmore 2.51 1.82 CDC Austenson 2.45 1.63 Champion 2.66 1.69 Brahma 2.60 1.80 AB Wrangler 2.54 1.89 Malting AC Metcalfe 2.41 0.14 1.86 0.01 CDC Copeland 2.49 0.14 1.77 0.01 AAC Synergy 2.44 0.18 1.66 0.11 AAC Connect 2.31 0.17 1.65 0.12 CDC Bow 2.42 1.66 CDC Fraser 2.60 0.09 1.90 0.08 *SD = standard deviation
Figure 3.2 (a) Content of β-glucans in various genotypes of specialty food (hulless), food/general purpose and malting barley before and after dehulling. The values for malting varieties represent averages for samples grown in two different locations.
.png)
-
Details
Total β-glucan (%, db) covered barley (unhulled) barley after dehulling Class Variety β-glucans (%,db) SD* β-glucans (%,db) SD* Specialty Food (Hulless) CDC Fibar 9.02 CDC Hilose 7.59 CDC Marlina 7.55 CDC Valdres 8.28 Food/General Purpose Canmore 4.23 4.67 CDC Austenson 4.13 4.70 Champion 3.55 4.09 Brahma 3.21 3.58 AB Wrangler 4.69 5.10 Malting AC Metcalfe 4.19 0.12 4.67 0.11 CDC Copeland 3.47 0.04 3.93 0.21 AAC Synergy 3.92 0.20 4.38 0.16 AAC Connect 3.87 0.11 4.31 0.02 CDC Bow 3.91 4.34 CDC Fraser 4.13 0.10 4.57 0.10 *SD = standard deviation
Figure 3.2 (b) Content of arabinoxylans (AX) in various genotypes of specialty food (hulless), food/general purpose and malting barley before and after dehulling. The values for malting varieties represent averages for samples grown in two different locations.
.png)
-
Details
Total AX (%, db) covered barley (unhulled) barley after dehulling Class Variety Arabinoxylans (%,db) SD* Arabinoxylans (%,db) SD* Specialty Food (Hulless) CDC Fibar 5.32 CDC Hilose 5.70 CDC Marlina 5.11 CDC Valdres 4.94 Food/General Purpose Canmore 6.30 4.54 CDC Austenson 7.19 4.70 Champion 7.89 4.83 Brahma 7.26 4.13 AB Wrangler 6.87 4.79 Malting AC Metcalfe 7.37 0.28 4.88 0.28 CDC Copeland 6.81 0.06 4.61 0.13 AAC Synergy 6.68 0.16 4.47 0.07 AAC Connect 6.63 0.23 4.26 0.03 CDC Bow 6.58 4.24 CDC Fraser 6.76 0.01 4.55 0.13 *SD = standard deviation
Figure 3.3 (a) Content of starch in various genotypes of specialty food (hulless), food/general purpose and malting barley before and after dehulling. The values for malting varieties represent averages for samples grown in two different locations.
.png)
-
Details
Total starch (%, db) covered barley (unhulled) barley after dehulling Class Variety Starch (%,db) SD* Starch (%,db) SD* Specialty Food (Hulless) CDC Fibar 55.60 CDC Hilose 57.19 CDC Marlina 59.34 CDC Valdres 58.35 Food/General Purpose Canmore 58.80 66.81 CDC Austenson 58.27 67.36 Champion 58.33 67.49 Brahma 58.47 67.31 AB Wrangler 59.50 65.99 Malting AC Metcalfe 59.38 1.63 66.76 1.35 CDC Copeland 60.53 0.34 68.24 0.59 AAC Synergy 60.05 0.42 67.88 0.09 AAC Connect 60.29 0.18 66.37 0.04 CDC Bow 59.88 67.94 CDC Fraser 60.05 0.06 67.01 0.18 *SD = standard deviation
Figure 3.3 (b) Content of lipids in various genotypes of specialty food (hulless), food/general purpose and malting barley before and after dehulling. The values for malting varieties represent averages for samples grown in two different locations.
.png)
-
Details
Lipids (%, db) covered barley (unhulled) barley after dehulling Class Variety Lipids (%,db) SD* Lipids (%,db) SD* Specialty Food (Hulless) CDC Fibar 2.83 CDC Hilose 3.00 CDC Marlina 2.81 CDC Valdres 2.62 Food/General Purpose Canmore 2.41 2.07 CDC Austenson 2.32 2.02 Champion 2.07 2.02 Brahma 2.12 2.06 AB Wrangler 2.05 1.89 Malting AC Metcalfe 2.51 0.37 2.02 0.01 CDC Copeland 2.57 0.04 2.34 0.17 AAC Synergy 2.26 0.13 1.965 0.23 AAC Connect 2.34 0.18 1.90 0.08 CDC Bow 2.30 2.1 CDC Fraser 2.34 0.11 2.07 0.11 *SD = standard deviation
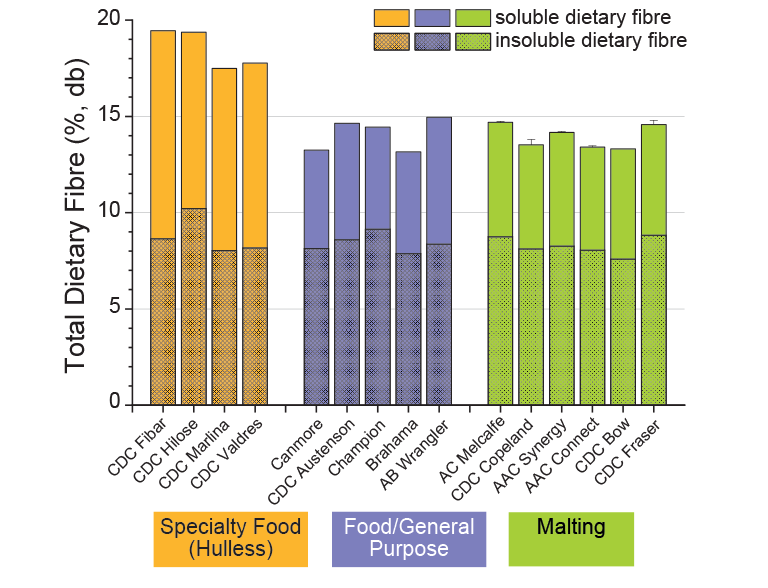
Figure 3.4 Content of soluble, insoluble, and total dietary in hulless specialty food and in dehulled food/general purpose and malting barley genotypes.
-
Details
Total Dietary Fibre (%, db) covered barley (unhulled) barley after dehulling Class Variety Dietary Fibre (%, db) SD* Dietary Fibre (%, db) SD* Specialty Food (Hulless) CDC Fibar 2.83 CDC Hilose 3.00 CDC Marlina 2.81 CDC Valdres 2.62 Food/General Purpose Canmore 2.41 2.07 CDC Austenson 2.32 2.02 Champion 2.07 2.02 Brahma 2.12 2.06 AB Wrangler 2.05 1.89 Malting AC Metcalfe 2.51 0.37 2.02 0.01 CDC Copeland 2.57 0.04 2.34 0.17 AAC Synergy 2.26 0.13 1.965 0.23 AAC Connect 2.34 0.18 1.90 0.08 CDC Bow 2.30 2.1 CDC Fraser 2.34 0.11 2.07 0.11 *SD = standard deviation
Figure 3.5 Tocopherols, tocotrienols, and total vitamin E in hulless specialty food and in dehulled food/general purpose and malting barley genotypes.

-
Details
Tocopherols (ug/100g, db) covered barley (unhulled) barley after dehulling Class Variety Tocopherols (ug/100g, db) SD* Tocopherols (ug/100g, db) SD* Specialty Food (Hulless) CDC Fibar 15.80 66.98 CDC Hilose 17.86 66.73 CDC Marlina 14.87 61.39 CDC Valdres 13.46 56.56 Food/General Purpose Canmore 7.71 57.90 CDC Austenson 9.97 68.49 Champion 9.65 72.70 Brahma 9.44 58.79 AB Wrangler 5.98 58.42 Malting AC Metcalfe 8.50 1.79 61.16 3.58 CDC Copeland 6.85 0.05 54.85 6.17 AAC Synergy 7.50 0.90 60.27 4.79 AAC Connect 7.72 1.12 52.77 3.26 CDC Bow 6.90 70.11 CDC Fraser 9.60 0.08 67.09 0.22 *SD = standard deviation
Table 3.1 Content of essential minerals in selected genotypes of specialty food (hulless) barley (CDC Hilose and CDC Valdres), in dehulled food/general purpose barley (Canmore and AB Wrangler), and in dehulled malting barley (CDC Copeland and AAC Synergy).
| CDC Hilose | CDC Valdresz | Canmore a | AB Wrangler a | CDC Copeland a | AAC Synergy a | |
|---|---|---|---|---|---|---|
| Ca (mg/kg) | 307 | 437 | 287 | 272 | 319 | 289 |
| Fe (mg/kg) | 39.8 | 71.0 | 37.6 | 28.3 | 37.5 | 37.4 |
| K (mg/kg) | 4530 | 4310 | 4470 | 4910 | 4030 | 4180 |
| Mg (mg/kg) | 1220 | 1390 | 1250 | 1210 | 1240 | 1140 |
| Mn (mg/kg) | 14.4 | 10.8 | 9.24 | 8.29 | 14.3 | 13.1 |
| P (mg/kg) | 3190 | 3520 | 3200 | 3150 | 3130 | 3030 |
| Zn (mg/kg) | 25.8 | 34.2 | 22.6 | 22.4 | 23.2 | 19.4 |
| a dehulled grain | ||||||
Figure 3.6 (a) Relative amount of vitamin E constituents expressed as a percentage of the total tocols content in grain of the specialty food (hulless) barley CDC Fibar.

-
Details
(αT = α-tocopherol, βT = β-tocopherol, γT = γ-tocopherol, δT = δ-tocopherol, αT3 = α-tocotrienol, βT3 = β-tocotrienol, γT3 = γ-tocotrienol, δT3 = δ-tocotrienol)
Figure 3.6 (b) Relative amount of vitamin E constituents expressed as a percentage of the total tocols content in grain of the specialty food (hulless) barley CDC Hilose.

-
Details
(αT = α-tocopherol, βT = β-tocopherol, γT = γ-tocopherol, δT = δ-tocopherol, αT3 = α-tocotrienol, βT3 = β-tocotrienol, γT3 = γ-tocotrienol, δT3 = δ-tocotrienol)
Figure 3.6 (c) Relative amount of vitamin E constituents expressed as a percentage of the total tocols content in grain of the dehulled food/general purpose barley Canmore.

-
Details
(αT = α-tocopherol, βT = β-tocopherol, γT = γ-tocopherol, δT = δ-tocopherol, αT3 = α-tocotrienol, βT3 = β-tocotrienol, γT3 = γ-tocotrienol, δT3 = δ-tocotrienol)
Figure 3.6 (d) Relative amount of vitamin E constituents expressed as a percentage of the total tocols content in grain of the dehulled food/general purpose barley CDC Champion.

-
Details
(αT = α-tocopherol, βT = β-tocopherol, γT = γ-tocopherol, δT = δ-tocopherol, αT3 = α-tocotrienol, βT3 = β-tocotrienol, γT3 = γ-tocotrienol, δT3 = δ-tocotrienol)
Figure 3.6 (e) Relative amount of vitamin E constituents expressed as a percentage of the total tocols content in grain of the malting barley CDC Bow.

-
Details
(αT = α-tocopherol, βT = β-tocopherol, γT = γ-tocopherol, δT = δ-tocopherol, αT3 = α-tocotrienol, βT3 = β-tocotrienol, γT3 = γ-tocotrienol, δT3 = δ-tocotrienol)
Figure 3.6 (f) Relative amount of vitamin E constituents expressed as a percentage of the total tocols content in grain of the malting barley CDC Fraser.

-
Details
(αT = α-tocopherol, βT = β-tocopherol, γT = γ-tocopherol, δT = δ-tocopherol, αT3 = α-tocotrienol, βT3 = β-tocotrienol, γT3 = γ-tocotrienol, δT3 = δ-tocotrienol)
"Page details"
- Date modified: