
Evaluation of the Harvest Sample Program
Appendices
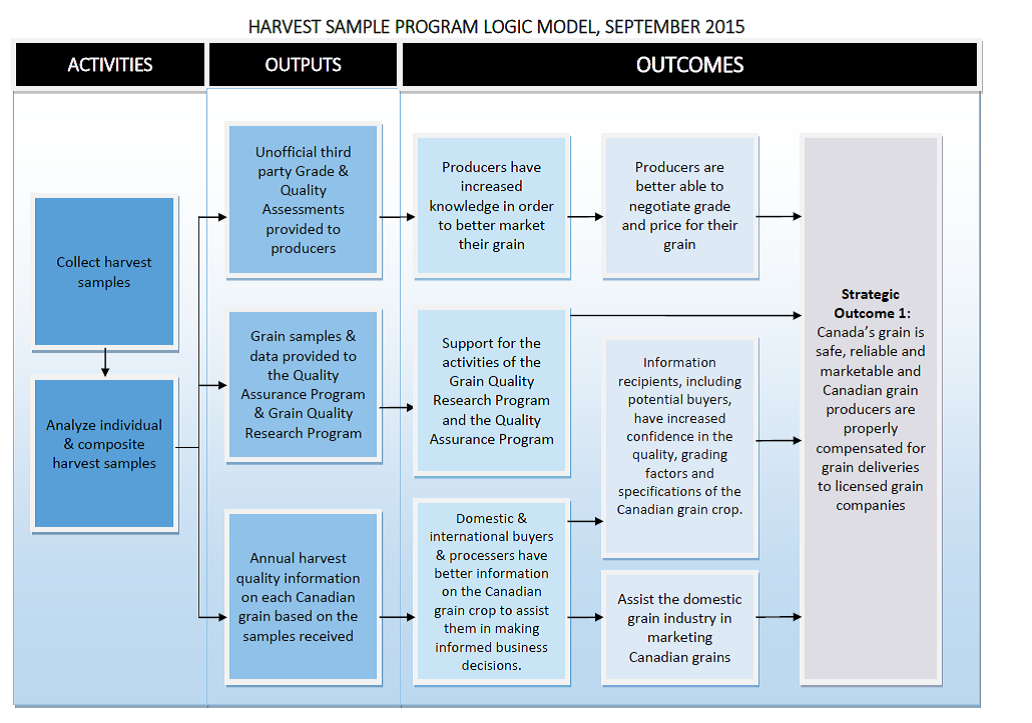
Appenix 1: Harvest Sample Program Logic Model, September 2015
Details
| Activities | Outputs | Outcomes | ||
|---|---|---|---|---|
| Collect harvest samples | Strategic Outcome 1: Canada's grain is safe, reliable and marketable and Canadian grain producers are properly compensated for grain delivers to licensed grain companies | |||
| Analyze individual and composite harvest samples | Unofficial third party Grade and Quality Assessments provided to producers | Producers have increased knowledge in order to better market their grain | Producers are better able to negotiate grade and price for their grain | |
| Grain sample and data provided to the Quakity Assurance Program and Grain Quality Research Program | Support for the activities of the Grain Quality Research Program and the Quality Assurance Program | |||
| Annual harvest quality information on each Canadian grain based on the samples received | Domestic and international buyers and processers have better information on the Canadian grain crop to assist them in making informed business decisions | Information recipients, including potential buyers, have increased confidence in the quality, grading factors, and specifications of the Canadian grain crop | ||
| Assist the domestic grain industry in marketing Canadian grains | ||||
Appenix 2: Harvest quality data parameters
| Commodity | Quality data parameters |
|---|---|
| Wheat |
|
| Canola | Chlorophyll content, Iodine value, Oil content, Protein content, Total glucosinolates content |
| Flaxseed | Iodine value, Oil content, Protein content |
| Lentils | Protein content |
| Malting barley | Test Weight (kg/hL), 1000 kernel weight (g), Plump %, Protein, Germination energy 4ml %, Germination energy 8ml % |
| Peas | Protein content |
Source: Canadian Grain Commission, 2015 Harvest and Export Quality Reports
Appenix 3: Demographics of registered producers surveyed
| Characteristic | Non-participating producers (n=125) | Participating producers (n=1,207) | Characteristic | Total population of producers | |||
|---|---|---|---|---|---|---|---|
| Province or territory | % | # | % | # | Province or territory (grains and oilseeds) | % | # |
| British Columbia | 0.8 | 1 | 0.4 | 5 | British Columbia | 1.0 | 2187 |
| Alberta | 26.4 | 32 | 30.3 | 344 | Alberta | 20.7 | 47407 |
| Saskatchewan | 41.3 | 50 | 48.7 | 553 | Saskatchewan | 30.4 | 69665 |
| Manitoba | 7.4 | 9 | 14.9 | 169 | Manitoba | 10.0 | 22882 |
| Ontario | 10.7 | 13 | 3.2 | 36 | Ontario | 26.4 | 60495 |
| Quebec | 12.4 | 15 | 2.3 | 26 | Quebec | 10.2 | 23375 |
| New Brunswick | 0.8 | 1 | 0.1 | 1 | New Brunswick | 0.4 | 971 |
| Nova Scotia | 0.0 | 0 | 0.0 | 0 | Nova Scotia | 0.3 | 796 |
| Prince Edward Island | 0.0 | 0 | 0.1 | 1 | Prince Edward Island | 0.5 | 1259 |
| Newfoundland and Labrador | 0.0 | 0 | 0.0 | 0 | Newfoundland and Labrador | 0.0 | 29 |
| Yukon | 0.0 | 0 | 0.0 | 0 | Yukon | 0.0 | 28 |
| Age | % | # | % | # | Age (age commodities) | % | # |
| 18 to 35 | 14.8 | 17 | 7.8 | 86 | 35 and under | 8.2 | 48265 |
| 36 to 50 | 24.3 | 28 | 19.1 | 211 | 35 to 54 | 43.5 | 255870 |
| 51 to 64 | 50.4 | 58 | 20.1 | 222 | 55 and above | 48.3 | 283980 |
| 64 and above | 10.4 | 12 | 53.0 | 585 | |||
| Acreage | % | # | % | # | Acreage (all commodities) | % | # |
| Under 1,000 acres | 43.0 | 48 | 30.4 | 332 | Under 1,119 acres | 81.9 | 168,701 |
| 1,000 to 1,999 acres | 23.0 | 26 | 30.3 | 331 | 1,120 to 2,239 acres | 9.7 | 20056 |
| 2,000 to 3,999 acres | 17.0 | 19 | 23.8 | 260 | 2,240 to 2,879 acres | 2.5 | 5231 |
| 4,000 to 5,999 acres | 8.0 | 9 | 9.9 | 108 | 2,880 to 3,519 acres | 1.7 | 3482 |
| 6,000 acres and over | 9.0 | 10 | 5.5 | 60 | 3,520 acres and over | 4.1 | 8419 |
| Gross farm revenue | % | # | % | # | Gross farm revenue (all commodities) | % | # |
| Less than $100,000 | 13.3 | 14 | 10.0 | 101 | Less than $100,000 | 62.3 | 128171 |
| $100,000 to $249,000 | 21.0 | 22 | 22.7 | 229 | $100,000 to $249,000 | 15.4 | 31679 |
| $250,000 to $499,999 | 29.5 | 31 | 25.4 | 257 | $250,000 to $499,999 | 10.9 | 22458 |
| $500,000 to $999,999 | 16.2 | 17 | 20.9 | 211 | $500,000 to $999,999 | 6.8 | 13978 |
| $1,000,000 to $2,499,999 | 14.3 | 15 | 17.4 | 176 | $1,000,000 to $1,999,999 | 3.1 | 6304 |
| $2,500,000 to $5,000,000 | 5.7 | 6 | 2.0 | 20 | Over $2,000,000 | 1.6 | 3299 |
| Over $5,000,000 | 0.0 | 0 | 1.6 | 16 | |||
| Grains produced | % | # | % | # | Grains produced | % | # |
| Canada Eastern Red Spring | 5.9 | 7 | 2.7 | 32 | Spring wheat (excluding durum) | 15.5 | 35541 |
| Canada Western Red Spring Wheat | 42.4 | 50 | 71.1 | 848 | |||
| Canada Prairie Spring Red Wheat | 13.6 | 16 | 12.4 | 148 | |||
| Canada Prairie Spring White Wheat | 5.1 | 6 | 1.5 | 18 | |||
| Canada Western Hard White Spring Wheat | 5.9 | 7 | 4.4 | 53 | |||
| Canada Western Soft White Spring Wheat | 5.1 | 6 | 2.2 | 26 | |||
| Canada Eastern Red Winter | 1.7 | 2 | 0.8 | 10 | Winter wheat | 6.4 | 14595 |
| Canada Eastern Soft Red Winter | 7.6 | 9 | 1.8 | 22 | |||
| Canada Eastern White Winter | 3.4 | 4 | 0.2 | 2 | |||
| Canada Western Red Winter Wheat | 5.9 | 7 | 6.7 | 80 | |||
| Canada Eastern General Purpose Barley | 7.6 | 9 | 1.0 | 12 | Barley | 13.1 | 29945 |
| Canada Western General Purpose Barley | 22.9 | 27 | 13.9 | 166 | |||
| Canada Western Amber Durum Wheat | 15.3 | 18 | 23.9 | 285 | Durum wheat | 3.2 | 7277 |
| Canada Western Extra Strong Wheat | 1.7 | 2 | 0.3 | 3 | Mixed grains | 3.1 | 7062 |
| Canada Western General Purpose Wheat | 4.2 | 5 | 1.7 | 20 | |||
| Flaxseed | 18.6 | 22 | 19.4 | 232 | Flaxseed | 2.0 | 4571 |
| Canola | 65.3 | 77 | 69.7 | 831 | Canola | 15.3 | 35073 |
| Chickpeas | 1.7 | 2 | 1.3 | 15 | Chickpeas | 0.1 | 293 |
| Corn | 22.0 | 26 | 1.1 | 13 | Corn | 10.2 | 23472 |
| Beans | 5.9 | 7 | 3.3 | 39 | Dry white beans and other dry beans | 0.7 | 1706 |
| Pea Beans | 0.8 | 1 | 0.3 | 4 | - | ||
| Lentils | 0.0 | 0 | 15.8 | 188 | Lentils | 2.1 | 4854 |
| Mustard | 5.9 | 7 | 4.9 | 59 | Mustard | 0.4 | 1012 |
| Oats | 38.1 | 45 | 11.6 | 138 | Oats | 12.7 | 29018 |
| Peas | 27.1 | 32 | 31.1 | 371 | Dry field peas | 3.3 | 7460 |
| Soybeans | 28.0 | 33 | 9.3 | 111 | Soybeans | 11.9 | 27215 |
| Other | 13.6 | 16 | 4.4 | 53 | - | ||
| Education | % | # | % | # | Education | % | # |
| High school/secondary school certificate or equivalent | 32.8 | 39 | 28.5 | 320 | - | N/A | N/A |
| College or university certificate or diploma (less than Bachelors) | 24.4 | 29 | 23.2 | 261 | - | N/A | N/A |
| Trades certificate or diploma | 19.3 | 23 | 16.2 | 182 | - | N/A | N/A |
| Bachelor's degree | 12.6 | 15 | 20.9 | 235 | - | N/A | N/A |
| Did not complete high school/secondary school | 9.2 | 11 | 6.6 | 74 | - | N/A | N/A |
| Other | 0.8 | 1 | 0.9 | 10 | - | N/A | N/A |
| Post-graduate degree | 0.8 | 1 | 3.7 | 42 | - | N/A | N/A |
Appenix 4: Harvest Sample Program response rate by region and commodity
| Commodity | 2011 | 2012 | 2013 | 2014 | ||||||||
|---|---|---|---|---|---|---|---|---|---|---|---|---|
| - | Sent | Returned | % | Sent | Returned | % | Sent | Returned | % | Sent | Returned | % |
| Eastern | - | |||||||||||
| Beans | 2 | 1 | 50.00 | 2 | 1 | 50.00 | 31 | 0 | 0.00 | 31 | 0 | 0.00 |
| Canola | 57 | 5 | 8.77 | 57 | 161 | 282.46 | 35 | 2 | 5.71 | 40 | 51 | 127.50 |
| CERS | 119 | 30 | 25.21 | 138 | 46 | 33.33 | 154 | 40 | 25.97 | 179 | 31 | 17.32 |
| CERW | 45 | 22 | 48.89 | 62 | 66 | 106.45 | 77 | 44 | 57.14 | 79 | 34 | 43.04 |
| CESRW | 152 | 46 | 30.26 | 187 | 243 | 129.95 | 207 | 356 | 171.98 | 239 | 349 | 146.03 |
| CEWW | 30 | 11 | 36.67 | 40 | 45 | 112.50 | 44 | 47 | 106.82 | 51 | 43 | 84.31 |
| Peabeans | 7 | 3 | 42.86 | 7 | 3 | 42.86 | 9 | 0 | 0.00 | 9 | 3 | 33.33 |
| Soybeans | 342 | 41 | 11.99 | 342 | 393 | 114.91 | 444 | 254 | 57.21 | 520 | 428 | 82.31 |
| Western | - | |||||||||||
| Beans | 25 | 5 | 20.00 | 35 | 18 | 51.43 | 45 | 7 | 15.56 | 45 | 6 | 13.33 |
| Canola | 2981 | 2062 | 69.17 | 3889 | 2640 | 67.88 | 4285 | 1679 | 39.18 | 5161 | 2295 | 44.47 |
| Chickpeas | 45 | 9 | 20.00 | 54 | 18 | 33.33 | 56 | 18 | 32.14 | 56 | 11 | 19.64 |
| CPSR | 297 | 51 | 17.17 | 338 | 61 | 18.05 | 378 | 86 | 22.75 | 559 | 229 | 40.97 |
| CPSW | 21 | 2 | 9.52 | 19 | 2 | 10.53 | 24 | 3 | 12.50 | 28 | 2 | 7.14 |
| CWAD | 1629 | 869 | 53.35 | 1963 | 1089 | 55.48 | 2066 | 950 | 45.98 | 2736 | 1374 | 50.22 |
| CWES | 12 | 2 | 16.67 | 12 | 2 | 16.67 | 16 | 1 | 6.25 | 7 | 0 | 0.00 |
| CWGP | 11 | 3 | 27.27 | 18 | 8 | 44.44 | 25 | 17 | 68.00 | 80 | 46 | 57.50 |
| CWHWS | 169 | 22 | 13.02 | 186 | 23 | 12.37 | 210 | 10 | 4.76 | 171 | 21 | 12.28 |
| CWRS | 5734 | 3354 | 58.49 | 6988 | 4156 | 59.47 | 7722 | 3267 | 42.31 | 9088 | 4941 | 54.37 |
| CWRW | 191 | 80 | 41.88 | 257 | 175 | 68.09 | 384 | 125 | 32.55 | 458 | 174 | 37.99 |
| CWSWSCWSWS | 100 | 36 | 36.00 | 111 | 57 | 51.35 | 171 | 79 | 46.20 | 218 | 48 | 22.02 |
| Flax | 834 | 181 | 21.70 | 893 | 214 | 23.96 | 967 | 86 | 8.89 | 1178 | 272 | 23.09 |
| Lentils | 266 | 331 | 124.44 | 378 | 347 | 91.80 | 462 | 212 | 45.89 | 462 | 384 | 83.12 |
| Mustard | 370 | 178 | 48.11 | 401 | 148 | 36.91 | 414 | 100 | 24.15 | 497 | 294 | 59.15 |
| Peabeans | 25 | 36 | 144.00 | 28 | 49 | 175.00 | 29 | 0 | 0.00 | 29 | 2 | 6.90 |
| Peas | 544 | 307 | 56.43 | 719 | 359 | 49.93 | 828 | 346 | 41.79 | 828 | 476 | 57.49 |
| Soybeans | 171 | 65 | 38.01 | 204 | 126 | 61.76 | 217 | 74 | 34.10 | 352 | 126 | 35.80 |
| Total | 14179 | 7752 | 54.67 | 17328 | 10450 | 60.31 | 19300 | 7803 | 40.43 | 23101 | 11640 | 50.39 |
Appenix 5: List of documents reviewed
- Canadian Grain Commission, 2005-2006 Harvest Survey Program Review
- Canadian Grain Commission, 2006 Harvest Survey Management Action Plan Review
- Canadian Grain Commission, 2006 Proposed Sampling Strategy for Harvest Survey
- Canadian Grain Commission, 2008 to 2009 Cargo Data vs. Harvest Data Comparison
- Canadian Grain Commission, 2008 to 2011 Harvest Sample Summary
- Canadian Grain Commission, 2010-11 Report on Plans and Priorities
- Canadian Grain Commission, 2011-12 Report on Plans and Priorities
- Canadian Grain Commission, 2012-13 Report on Plans and Priorities
- Canadian Grain Commission, 2013-14 Report on Plans and Priorities
- Canadian Grain Commission, 2014-15 Report on Plans and Priorities
- Canadian Grain Commission, 2015-16 Report on Plans and Priorities
- Canadian Grain Commission, Harvest Survey Collection Summary, August 2011
- Canadian Grain Commission, Harvest Survey Collection Summary, August 2012
- Canadian Grain Commission, Harvest Survey Collection Summary, October 2013
- Canadian Grain Commission, Harvest Survey Collection Summary, December 2014
- Canadian Grain Commission, 2010-11 Departmental Performance Report
- Canadian Grain Commission, 2011-12 Departmental Performance Report
- Canadian Grain Commission, 2012-13 Departmental Performance Report
- Canadian Grain Commission, 2013-14 Departmental Performance Report
- Canadian Grain Commission, 2014-15 Departmental Performance Report
- Canadian Grain Commission, Canadian Wheat Classes. Last update 2015-08-05. Retrieved from: https://www.grainscanada.gc.ca/wheat-ble/classes/classes-eng.htm
- Canadian Grain Commission, Wheat methods and tests used to measure quality. Accessed January 2016: https://www.grainscanada.gc.ca/wheat-ble/method-methode/wmtm-mmab-eng.htm
- Canadian Grain Commission, Follow-up Report on Harvest Sample Program (HSP) Review 2005-2006. May 2011
- Canadian International Grains Institute, "Cigi, CGC, and Cereals Canada meeting with wheat customers worldwide to discuss new crop". November 12, 2015 https://cigi.ca/cigi-cgc-and-cereals-canada-meeting-with-wheat-customers-worldwide-to-discuss-new-crop/
- Canadian Grain Commission, Harvest Sample Program Logic Model, September 29, 2015
- Canadian Grain Commission, Harvest Survey Review, Draft March 19, 2004
- Canadian Grain Commission, Quality Data of Western Canadian Wheat, 2015. Accessed December 2015: https://www.grainscanada.gc.ca/wheat-ble/harvest-recolte/2015/sqd-dqs-2015-en.htm
- Canadian Grain Commission, Quality Data of Western Canadian Canola, 2015. Accessed December 2015: https://www.grainscanada.gc.ca/canola/harvest-recolte/2015/hqc15-qrc15-en.htm
- Canadian Grain Commission, Quality Data of Western Canadian Flaxseed, 2015. Accessed December 2015: https://www.grainscanada.gc.ca/flax-lin/harvest-recolte/2015/hqf15-qrl15-eng.htm
- Canadian Grain Commission, Quality Data of Western Canadian Lentils, 2015. Accessed December 2015: https://www.grainscanada.gc.ca/lentils-lentille/harvest-recolte/2015/hql15-qrl15-eng.htm
- Canadian Grain Commission, Quality of Barley Selected for Malting, 2015. Accessed December 2015: https://www.grainscanada.gc.ca/barley-orge/harvest-recolte/2015/qbsm15-qosm15-en.htm
- Canadian Grain Commission, Quality of Western Canadian Peas, 2015. Accessed December 2015: https://www.grainscanada.gc.ca/peas-pois/harvest-recolte/2015/hqp15-qrp15-eng.htm
- Canadian Grain Commission, The Harvest Survey: An 88 year Tradition of Quality Evaluation, PowerPoint Presentation. Last updated September 2015
- Canadian Grain Commission, 2010 to 2011 Harvest Survey Expenses
- Canadian Grain Commission, 2011 to 2012 Year to Date Expenses
- Canadian Grain Commission, 2012 to 2013 Year to Date Expenses
- Canadian Grain Commission, 2013 to 2014 Year to Date Expenses
- Canadian Grain Commission, 2014 to 2015 Year to Date Expenses
- Canadian Grain Commission, 2015 to 2016 Year to Date Expenses
- Ipsos Reid, 2001 Producer Opinion Survey Final Report, March 1, 2001
- Ipsos Reid, 2002 Customer Satisfaction Study Industry Report. December 16, 2002
- Ipsos Reid, 2010 Canadian Grain Commission Satisfaction Survey: Final Report. December 2010
- Lyman, G. J. Examination of Methods of Harvest Survey Sample Preparation and Cargo Composite Sample Preparation with Brief Notes on Compliance with ISO 17025. March 2009
- Ministry of Justice Canada, Canada Grain Act, R.S.C., 1985, c. G-10. Last amended on July 30, 2015. Section 3, Para. 14. Pg. 10. Retrieved from: http://laws-lois.justice.gc.ca
- Treasury Board of Canada Secretariat, Policy on Evaluation (2009). Retrieved from: http://www.tbs-sct.gc.ca/pol/doc-eng.aspx?id=15024
Appenix 6: List of literature reviewed
- AHDB Cereals & Oilseeds.-Cereal Quality Survey 2015 Final Results http://cereals.ahdb.org.uk/media/765348/final-cqs-results-2015.pdf
- AHDB Cereals & Oilseeds. AHDB Cereals & Oilseeds: Independence, Innovation and Investment. http://cereals.ahdb.org.uk/media/656994/ahdb-co-ahdb-cereals-oilseeds.pdf
- AHDB Cereals & Oilseeds. Cereal Quality Calculator. http://cereals-data.ahdb.org.uk/calculator/
- AHDB Cereals & Oilseeds. Cereals Quality Survey Methodology. http://cereals.ahdb.org.uk/markets/survey-results/cereals-quality-survey-methodology.aspx
- Arvalis – Institut du vegetal.Valeurs et Missions. http://www.arvalisinstitutduvegetal.fr/index.html
- Australian Export Grains Innovation Centre.2014 Australian Wheat Quality Report. http://www.aegic.org.au/media/australian-wheat-quality-report.aspx
- Australian Export Grains Innovation Centre.Capability Statement. http://www.aegic.org.au/media/37735/AEGIC%20Capability%20Statement.pdf
- Australian Export Grains Innovation Centre.Home. http://www.aegic.org.au/
- Australian Export Grains Innovation Centre, GrainGrowers. Australian Wheat Quality Report: Season 2014. http://www.aegic.org.au/media/51509/AEGIC_and_GG_Wheat_Quality_Report_LR.pdf
- California Wheat Commission.2014 Hard Red Wheat / Hard White Wheat Crop Quality Report. http://www.californiawheat.org/uploads/resources/713/2014-hrw-hw-crop-quality-report.pdf
- California Wheat Commission. About the California Wheat Commission. http://www.californiawheat.org/about/
- California Wheat Commission. California Wheat Crop Quality Reports. Http://Www.Californiawheat.Org/Industry/Ca-Crop-Quality-Reports/
- Canadian International Grains Institute. 2015 Crop In Review. https://cigi.ca/wp-content/uploads/2015/11/Western-Canadian-Wheat-2015-Crop-in-Review.pdf
- Canadian International Grains Institute. Annual Report 2014-2015.https://cigi.ca/wp-content/uploads/2015/06/Cigi-Annual-Report-2014-2015_15041001.pdf
- Canadian International Grains Institute, Quality of 2015 Wheat Classes, pg. 2. https://cigi.ca/wp-content/uploads/2015/11/Quality-of-2015-Wheat-Classes_151117.pdf
- FranceAgrimer, Missions. http://www.franceagrimer.fr/Etablissement/Missions/%28language%29/eng-GB
- FranceAgriMer. Quality of French Wheat. http://www.franceagrimer.fr/content/download/40630/378241/file/ENQ-CER-qualit%C3%A9BTanglais-A15.pdf
- Grain Farmers of Ontario, 2013 Annual Report. http://gfo.ca/Portals/0/About%20Us/Annual%20Report%20and%20Strategic%20Plan/GFO-Annual%20Report%202015.pdf?ver=2015-09-24-142613-177
- Grain Farmers of Ontario, 2013 Ontario Quality Scoop Report. http://gfo.ca/Production/Ontario-Wheat-Quality
- Grain Farmers of Ontario, 2015 Annual Report. http://gfo.ca/Portals/0/About%20Us/Annual%20Report%20and%20Strategic%20Plan/GFO-Annual%20Report%202015.pdf?ver=2015-09-24-142613-177
- Grain Farmers of Ontario, Quality Data: Ontario Wheat Technical Information, Quality Data for 2015 Harvest Survey Grade Composite Samples. http://gfo.ca/Production/Ontario-Wheat-Quality
- Grain Trade Australia. About Grain Trade Australia. http://www.graintrade.org.au/sites/default/files/Publications/001%20About%20Grain%20Trade%20Australia.pdf
- Grain Trade Australia. Strategic Direction 2014/2015. http://www.graintrade.org.au/sites/default/files/file/About%20GTA/Strategic%20Direction%202014%20Final.pdf
- GrainGrowers. Australian Wheat Quality Report Sample Information. http://www.graingrowers.com.au/images/50_products_services/nat_wheat_quality_report/151021%20ggl_104019_wheat%20quality%2002.pdf
- Great Plains Analytical Lab. About Us. http://www.gpalab.com/index.cfm/category/12/about-us.cfm
- Great Plains Analytical Lab. Crop Survey Info. http://www.gpalab.com/index.cfm/category/14/crop-survey-info.cfm
- Gwirtz, J. A., Willyard, M. R., & McFall, K. L. (2007). Wheat quality in the United States of America. Future of Flour - A Compendium of Flour Improvement
- North Dakota Wheat Commission. 2014 U.S. Hard Red Spring Wheat Regional Quality Report. http://www.ndwheat.com/uploads/resources/942/hrs-2014.pdf
- North Dakota Wheat Commission, About Us: Programs. http://www.ndwheat.com/about/default.asp?ID=277
- North Dakota Wheat Commission. Publications. http://www.ndwheat.com/publications/default.asp?ID=513
- Plains Grains Inc. About Us. Accessed October. 2015. http://plainsgrains.org/about-us/
- Plains Grains Inc. 2015 Hard Red Winter Wheat Regional Quality Survey. http://plainsgrains.org/wp-content/uploads/2016/01/PGI_2015-HRW-Report.pdf
- Plains Grains Inc. Our Product. Accessed January, 2016. http://plainsgrains.org/our-product/
- U.S. Congress, Office of Technology Assessment. (1989). The French (EC) grain system. Grain Quality in International Trade, 49-78
- U.S. Grains Council, Corn Harvest Quality and Export Cargo Reports. http://www.grains.org/key-issues/grain-supply-and-demand/corn-harvest-quality-and-export-cargo-reports
- U.S. Grains Council. 2015/2016 Corn Harvest Quality Report. http://grains.org/sites/default/files/2015CornHarvestReport.pdf
- U.S. Grains Council. Grain Quality and U.S. Standards. http://www.grains.org/buyingselling/importer-manual/chapter-4-grain-quality-and-us-standards
- U.S. Grains Council, Who We Are: Council FAQs. http://www.grains.org/who-we-are/council-faqs
- U.S. Grains Council, Who We Are: US Grains Council Activities. http://www.grains.org/who-we-are
- United States Department of Agriculture Grain Inspection, Packers & Stockyards Administration. Federal grain inspection service: 2014 annual report.http://www.gipsa.usda.gov/fgis/publication/ar/2014-fgis-AR.pdf
- United States Department of Agriculture Grain Inspection, Packers & Stockyards Administration. Grain inspection handbook. http://www.gipsa.usda.gov/fgis/handbook/grain-insp/grbook2/wheat.pdf
- US Department of Agriculture, Grain Inspection, Packers & Stockyards Administration, About FGIS. http://www.gipsa.usda.gov/fgis/fgis.aspx
- US Department of Agriculture, Grain Inspection, Packers & Stockyards Administration, About GIPSA. http://www.gipsa.usda.gov/about/About.aspx
- US Department of Agriculture Research Service. http://www.ars.usda.gov/research/projects/projects.htm?accn_no=427022
- U.S. Wheat Associates. 2015 Crop Quality Report. http://www.uswheat.org/cropQuality/doc/E5D36CBA6BC187E485257EEA006A4C13/$File/CQR2015.pdf?OpenElement#
- U.S. Wheat Associates. About Us. Accessed September 8, 2015.http://www.uswheat.org/aboutUs
- U.S. Wheat Associates. Crop Quality Reports. Accessed September 8, 2015. http://www.uswheat.org/cropQuality
- U.S. Wheat Associates. Harvest Reports. Accessed September 8, 2015. http://www.uswheat.org/harvest
- U.S. Wheat Associates. U.S. Durum Wheat Regional Quality Report 2015. http://www.uswheat.org/cropQuality/doc/42F2B60BC09A57C485257EE4004280C5/$File/durum2015.pdf?OpenElement#
- U.S. Wheat Associates. Working with Customers. Accessed September 8, 2015.http://www.uswheat.org/customers
"Page details"
- Date modified: