
Evaluation of the Harvest Sample Program
Evaluation findings
Relevance
Alignment with federal roles, responsibilities and priorities and Canadian Grain Commission strategic outcomes
Although the Harvest Sample Program is not mandated by the Canada Grain Act, the program’s activities and outputs support key legislated responsibilities of the Canadian Grain Commission. The program is aligned with federal priorities to ensure the growth, competitiveness and sustainability of the agriculture sector and the Canadian Grain Commission’s strategic outcome to ensure that “Canada’s grain is safe, reliable and marketable and Canadian grain producers are protected.” The program also supports the Canadian Grain Commission’s new organizational priority, “investing in stakeholder relations”, as identified in its 2015-16 Report on Plans and Priorities.
Alignment with federal roles and responsibilities
The roles and responsibilities of the Canadian Grain Commission are enacted in federal legislation through the Canada Grain Act. The Canadian Grain Commission’s mandate, as outlined in the act, is to “in the interests of grain producers, establish and maintain standards of quality for Canadian grain and regulate grain handling in Canada, to ensure a dependable commodity for domestic and export markets”. The Canadian Grain Commission has the authority and responsibility to maintain standards for and regulate the handling of 20 grains grown in Canada to ensure Canada’s grain is safe, reliable, and marketable and Canadian grain producers are properly compensated for grain deliveries to licensed grain companiesFootnote1.
While the Harvest Sample Program is not a mandated responsibility of the Canada Grain Act, the core harvest survey and related research activities undertaken using the collected samples directly support the Canadian Grain Commission’s federal responsibilities to:
- recommend and establish grain grades and standards for those grades, and implement a system of grading and inspection for Canadian grain to reflect adequately the quality of that grain and meet the need for efficient marketing in and outside Canada
- undertake, sponsor and promote research in relation to grain and grain productsFootnote2
Alignment with federal priorities and the Canadian Grain Commission strategic outcome
The objectives of the Harvest Sample Program align with federal priorities to ensure the growth, competitiveness and sustainability of Canada’s agricultural sector. The program’s objective to assist the grain industry in marketing Canadian grains aligns with the priorities outlined in Budget 2015 to promote trade opportunities for the agriculture and agri-food sector and market Canadian agricultural and agri-food products around the worldFootnote3. The program’s objectives are to increase stakeholders’ confidence in the quality, grading factors and specifications of the Canadian grain crop, and to provide producers with increased knowledge in order to better market their grain. These objectives are aligned with federal priorities to support freedom of marketing for western grain and barley producers, following the transition of the Canadian Wheat Board as identified in Budget 2013Footnote4 and the 2011 Speech from the ThroneFootnote5.
The objectives of the Harvest Sample Program are also closely aligned with the Canadian Grain Commission’s single strategic outcome to ensure that “Canada’s grain is safe, reliable and marketable and Canadian grain producers are protectedFootnote6.” As described above, through its support for the activities of the grain quality research and quality assurance programs, the Harvest Sample Program contributes to the establishment and maintenance of quality standards and the regulation of grain handling in Canada. The program’s outputs (i.e. the annual harvest quality reports and the unofficial grade and quality assessments provided to producers) help market Canadian grains to domestic and international end-users, and ensure producers possess the knowledge of their grains’ quality in order to make informed marketing decisions. The unofficial grade and assessment provided to participating producers aids in producer protection by providing a benchmark for comparison by which producers can assess buyers’ offers.
Lastly, the Harvest Sample Program supports the Canadian Grain Commission’s new organizational priority, “investing in stakeholder relations”, identified in its 2015-16 Report on Plans and PrioritiesFootnote7. The Canadian Grain Commission aims to promote awareness of its activities and services with the intention of increasing stakeholder understanding of the organization’s role in the grain sector. Communicating the value of Canadian Grain Commission activities, including the grading system, Harvest Sample Program, research activities, statistical reports and efforts to maintain and increase access to international markets are necessary in order to ensure its services are recognized as relevant and valuable by industry and producers, who contribute a significant portion of the Canadian Grain Commission’s funding.
Continued need for the program
There is a significant continued need for the Harvest Sample Program. The samples obtained are essential for supporting the objectives and activities of the grain quality research and quality assurance programs. The Harvest Sample Program is the primary or only source of materials for numerous Grain Quality Research Program staff. The program samples are ideal for research because the program sources pure, non-blended samples with an identified geographic location directly from producers at the beginning of the supply chain. While internal demand has remained largely consistent, changes in the marketing of grains and oilseeds, and the introduction of an open market for western wheat and barley have led to increased demand for the Harvest Sample Program outputs among many external beneficiaries. Use of the Canadian Grain Commission’s annual harvest quality reports by external beneficiaries is significant and is increasing.
Internal demand for the Harvest Sample Program
Program documents and interviews with 26 Canadian Grain Commission staff and managers show that the Harvest Sample Program is an essential source of sample materials for the Canadian Grain Commission’s grain quality research and quality assurance programs. Almost all Canadian Grain Commission staff and managers interviewed (92%) rated the need for the program as 5 on a scale of 1 to 5, signifying a major internal need. Canadian Grain Commission representatives explained that the samples obtained through the program enable the Canadian Grain Commission to perform its federally mandated responsibilities, including the Industry Services Division’s development of visual grading standards and monitoring and verification of grading factors, and the Grain Quality Research Program’s research on environmental conditions and other special research projects. A number of Grain Quality Research Program staff and managers explained that the Harvest Sample Program is the primary or only source of materials for their research, due to the fact that the program sources pure, non-blended samples with an identified geographic location directly from producers at the beginning of the supply chain. Alternative sources of materials including cargo shipment samples, plant breeder samples and composite samples obtained from elevators, producer associations or other stakeholders would be inappropriate based on the Canadian Grain Commission’s research needs.
Participation of producers in the Harvest Sample Program
The following figure depicts the number of registered producers in the Harvest Sample Program producer database between 2011 and 2015. In 2011, 7,197 producers were mailed sample kitsFootnote8, representing 14% of the 52,410 grain and oilseed farms in Canada with gross farm revenues of $25,000 or moreFootnote9Footnote10. Internal harvest survey summary reports indicate that between 2011 and 2014, an average of 320 new producers were added and 80 inactive producers were culled from the producer database each year. A significant cleaning of the producer database in 2015 led to the removal of 2,572 producers who had not submitted samples during the past 3 years. The major reasons why these producers had not submitted samples are retirement, relocation and death.
Figure 5.1: number of Harvest Sample Program registrants, 2011 to 2015
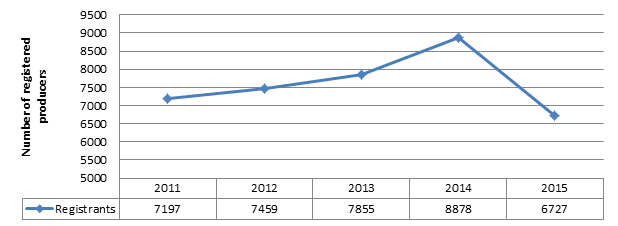
Source: Harvest Survey Annual Reports, 2011 to 2015
Details
| Year | Number of registered producers |
|---|---|
| 2011 | 7197 |
| 2012 | 7459 |
| 2013 | 7855 |
| 2014 | 8878 |
| 2015 | 6727 |
The survey of participating producers found program registrants to be disproportionately older than the overall Canadian farming community (Appendix 3). Almost 73% of the survey respondents were aged 51 and older, and 53% were 64 and older. Producers aged 36 to 50 were the most under-represented age cohort, representing 19% of all program participants as compared to 44% of all farmers in Canada.Footnote11 Given the older than average characteristics of program registrants, there is a significant need for continued promotion of the program and recruitment of younger producers in order to maintain a sufficiently large number of producer registrants. Since 2012, it has been a priority of the program to seek new registrants through increased representation at trade shows, use of social media, and leveraged promotion with industry stakeholders such as the Western Grain Elevator Association, Inland Terminal Association of Canada, Grain Farmers of Ontario and the Alberta Wheat Commission.Footnote12 Program data provides evidence that some progress has been made, but additional efforts are needed.
Interviews with Canadian Grain Commission representatives found that approximately three-quarters of all Canadian Grain Commission staff and management believe current uptake is based on a somewhat adequate or inadequate awareness of the Canadian Grain Commission and the Harvest Sample Program. These individuals explain that, despite efforts to increase awareness among producers, registration has been challenging. The majority believe that continued engagement with producer groups through farm shows, producer meetings, grading seminars and other events is needed. Some argue that, given ongoing difficulties obtaining sufficient registration, additional funding for radio and/or print advertisements in farm publications or newspapers or targeted direct marketing is required. The survey findings show that tradeshows, word of mouth, the Canadian Grain Commission website and advertisements in newsletters or trade magazines have been more successful to date at recruiting producers than social media and efforts to disseminate information via producer and other industry associations.
The number of samples submitted by producers varies from year to year, with more significant uptake occurring during poor quality harvests. Between 2010 and 2015, approximately 7,827 samples were submitted annually to the Harvest Sample Program. Submissions declined 24.4% between 2012 and 2013, likely due to the transition to the open market following the end of the Canadian Wheat Board monopoly and the high quality of the 2013 harvest. It should be noted that the 2013 Canadian Grain Commission internal summary report was produced in October before collection was complete, and consequently under-represents the number of samples collected. Even excluding 2013’s low participation, submissions among participating registrants have increased; 24% more samples were submitted in 2014 than in 2012. Harvest Sample Program webpage page views also increased 77% from 6,139 in 2012 to 10,846 in 2013 and then declined to 8,081 in 2015.Footnote13
Figure 5.2: total sample submitted to the Harvest Sample Program, 2010 to 2014

Details
| Year | Producers mailed packages | Samples submitted |
|---|---|---|
| 2010 | 8755 | |
| 2011 | 7752 | 7197 |
| 2012 | 7495 | 7543 |
| 2013 | 7855 | 5698 |
| 2014 | 8158 | 9389 |
Sample submissions also vary significantly by region and commodity. Western Canada accounted for 93% of all materials sourced between 2011 and 2014.Footnote14 As shown in the following table, eastern producers most frequently submit samples of soybeans, canola and Canada Eastern Soft Red Winter wheat. Western producers most frequently submit samples of Canada Western Red Spring wheat, canola, amber durum, peas and lentils. Submissions of less frequently grown commodities such as beans, chickpeas, peabeans and Canada Western Extra Strong wheat are variable and unpredictable. These usually provide the Canadian Grain Commission with materials to use for instrument calibration and pure varieties to support research activities.
| Western | 2011 | 2012 | 2013 | 2014 |
|---|---|---|---|---|
| Beans | 5 | 18 | 7 | 6 |
| Canola | 2062 | 2640 | 1679 | 2295 |
| Peabeans | 36 | 49 | 0 | 2 |
| Soybeans | 65 | 126 | 74 | 126 |
| Chickpeas | 9 | 18 | 18 | 11 |
| Canada Prairie Spring Red (CPSR) | 51 | 61 | 86 | 229 |
| Canada Prairie Spring White (CPSW) | 2 | 2 | 3 | 2 |
| Canada Western Amber Durum (CWAD) | 869 | 1089 | 950 | 1374 |
| Canada Western Extra Strong (CWES) | 2 | 2 | 1 | 0 |
| Canada Western General Purpose (CWGP) | 3 | 8 | 17 | 46 |
| Canada Western Hard White Spring (CWHWS) | 22 | 23 | 10 | 21 |
| Canada Western Red Spring (CWRS) | 3354 | 4156 | 3267 | 4941 |
| Canada Western Red Winter (CWRW) | 80 | 175 | 125 | 174 |
| Canada Western Soft White Spring (CWSWS) | 36 | 57 | 79 | 48 |
| Flax | 181 | 214 | 86 | 272 |
| Lentils | 331 | 347 | 212 | 384 |
| Mustard | 178 | 148 | 100 | 294 |
| Peas | 307 | 359 | 346 | 476 |
| Eastern | 2011 | 2012 | 2013 | 2014 |
| Beans | 1 | 1 | 0 | 0 |
| Canola | 5 | 161 | 2 | 51 |
| Peabeans | 3 | 3 | 0 | 3 |
| Soybeans | 41 | 393 | 254 | 428 |
| Canada Eastern Red Spring (CERS) | 30 | 46 | 40 | 31 |
| Canada Eastern Hard Red Winter (CEHRW) | 22 | 66 | 44 | 34 |
| Canada Eastern Soft Red Winter (CESRW) | 46 | 243 | 356 | 349 |
| Canada Eastern Soft White Winter (CEWW) | 11 | 45 | 47 | 43 |
Source: Canadian Grain Commission internal annual Harvest survey summary reports, 2011 to 2014
The survey of registered producers found that the majority reside in Saskatchewan (48%), Alberta (30%) and Manitoba (15%). Eighty-three percent farm 4,000 acres or less, with the majority of participants (60%) farming fewer than 2,000 planted acres. Participants’ most frequently grown commodities include Canada Western Red Spring wheat (71%), canola (69%), peas (31%), Canada Western Amber Durum wheat (23%) and flaxseed (19%). Participants most frequently have gross farm revenues between $100,000 and $500,000 (48%) or between $500,000 and $999,000 (21%), which is slightly over-representative of larger producers. For comparative purposes, the average gross farm revenue of a Canadian grain and oilseed producer in 2014 was $358,000.Footnote15 This corroborates the findings of Anh Phan in the 2009 Harvest Survey Review, which demonstrated that larger producers in Manitoba were more likely to participate in the Harvest Sample Program.Footnote16
An analysis of the 125 surveyed producers, who registered for the program but never submitted samples, indicates they are far more likely than producers who participate to:
- be located in Quebec or Ontario
- be aged 50 or younger
- farm 1,000 planted acres or fewer
- grow corn, barley, soybeans and oats
For a full breakdown of the characteristics of the participating producers and non-participating producers surveyed, see Appendix 3.
Perceived usefulness of the Harvest Sample Program among participating producers
Survey findings show that the primary reason why the vast majority of producers (91%) participate is to obtain an unofficial grade and quality assessment at no charge. However, the ability to support the marketing and end use of Canadian grains and the Canadian Grain Commission’s monitoring and assessment of the grain quality assurance system are also important considerations for many participants (70% and 61%, respectively).
The majority (68%) of participants find the program and the harvest quality reports and information useful or very useful. Twenty-two percent find them somewhat useful and less than 5% believe the program is of little or no use to them. The perceived usefulness of the program was shown to gradually diminish when producers’ annual gross farm revenues exceed $1 million, or when producers’ planted acreage of grains and oilseeds exceeds 6,000 acres. This is likely because very large producers have more negotiating power with buyers. They also more commonly have their own labs or pay for alternative testing from private labs or third-party providers. For these reasons, they rely less on the Harvest Sample Program unofficial grade than producers with lower revenues.
The Harvest Sample Program was found to be somewhat useful to producers in Ontario and Quebec (average ratings of 3.4 out of 5), as compared to all other provinces, which find the program useful or very useful (average ratings ranging from 4.1 to 5 out of 5). This is attributable to the high proportion of soybean producers in Ontario and Quebec. According to key informants, differences in the value chain for food grade soybeans (e.g. increased use of contract sales, the prevalence of niche markets and buyers’ reliance on their own lab analysis to determine desired end-use characteristics rather than Canadian Grain Commission grades) make the information provided by the Harvest Sample Program less valuable for marketing. This issue is discussed further in section 5.5.
Overall, the perceived usefulness of the Harvest Sample Program was found to be higher for western wheat producers than eastern wheat producers, and lower for producers of corn, beans and soybeans, as shown in Table 5.4. This is likely attributed to reasons previously identified for soybeans and the relatively limited amount of information provided to producers of beans and corn.
| Commodity | Non specified | Eastern region | Western region |
|---|---|---|---|
| Wheat | 3.6 | 4.2 | |
| Barley | 3.6 | 4.2 | |
| Flaxseed | 4.6 | 4.1 | |
| Canola | 4.2 | ||
| Oats | 4.2 | ||
| Corn | 3.3 | ||
| Chickpeas | 4.3 | ||
| Lentils | 4.2 | ||
| Beans | 3.7 | ||
| Soybeans | 3.8 | ||
| Peabeans | 4.3 | ||
| Mustard | 4.2 | ||
| Peas | 4.2 |
Producers most commonly use the unofficial grade and information as an unbiased second opinion to compare against potential buyers’ assessments (66%). The Harvest Sample Program information is also used by a third (34%) of producers to develop or support their marketing strategy. These producers may use the program information to determine which buyers would likely be most interested in their crop, how to target their marketing to maximize value, and as a promotional tool to advertise their grain to potential buyers. A small minority of producers also use the grade and assessment to gauge the influence of on-farm practices and weather conditions on grain quality (5%) or to compare against the regional or national averages provided in the Canadian Grain Commission annual quality reports (3%).
The 5% of producers who find the Harvest Sample Program to be of little or no use most frequently indicated that:
- the grade carries no weight with buyers because it is unofficial (23%)
- they do not understand how to access their results (23%)
- they have not needed to use their unofficial grade to dispute a buyer’s grade (23%)
- they require more detailed information than what is provided by the program (23%)
Participating producers explained that if they were unable to obtain the unofficial grade and quality assessment from the program, they would feel less confident making an educated assessment of the offers they receive from buyers and be more reliant on buyers’ grades and assessments to determine the quality and of their grain (32%). Some producers (24%) indicated they would incur additional expenses associated with obtaining an official grade and quality information from another source, and 10% would face an increased marketing burden due to the need to submit samples to many more buyers. About 23% indicated that they would be minimally affected, as they would continue to obtain grades from multiple buyers.
Demand for the Canadian Grain Commission annual harvest quality reports
Demand for the annual harvest quality reports published on the Canadian Grain Commission website is significant, and has increased during the past 5 years. The following table depicts the total number of page views (English and French) each harvest quality report received during its publication year.Footnote17 As shown, the total number of views for all Canadian Grain Commission reports combined within a given crop year increased 231% from 5,329 in 2009 to 17,662 in 2014. This suggests an increase in the perceived usefulness of the resources among external beneficiaries.
| Report | 2009 | 2010 | 2011 | 2012 | 2013 | 2014 | as of December 2015 |
|---|---|---|---|---|---|---|---|
| Quality of Western Canadian Wheat | 1242 | 2440 | 3212 | 6607 | 6208 | 8256 | 3371 |
| Quality of Western Canadian Canola | 1040 | 2447 | 2622 | 3783 | 2890 | 2819 | 1751 |
| Quality of Ontario Wheat | 1598 | 1135 | |||||
| Quality of Western Canadian Flaxseed | 716 | 713 | 639 | 1145 | 850 | 987 | 774 |
| Quality of Barley Selected for Malting | 580 | 600 | 683 | 453 | 775 | 1311 | 698 |
| Export Quality, Western Canadian Wheat | 835 | 656 | 824 | 263 | 688 | 578 | 952 |
| Quality of Canadian Food-Type Soybeans | 447 | 826 | 464 | 534 | |||
| Quality of Western Canadian Mustard | 444 | 320 | 442 | 442 | 517 | 951 | |
| Quality of Canadian Non-Food Grade Soybeans | 472 | 383 | 537 | 409 | 490 | 628 | 365 |
| Total | 5329 | 7559 | 9406 | 13928 | 12882 | 17662 | 9046 |
External beneficiaries’ use of harvest quality reports to compare results across years has also increased. The following figure depicts the cumulative number of webpage views the annual harvest quality reports received, from the date of publication up to December 2015. At the time of writing, cumulative data for 2015 was not available.
Figure 5.6: page views for Canadian Grain Commission annual harvest quality reports, 2009 to 2015

Details
| Year | Publication year views | Cumulative views |
|---|---|---|
| 2009 | 5329 | 11226 |
| 2010 | 7559 | 15664 |
| 2011 | 9406 | 16954 |
| 2012 | 13928 | 18113 |
| 2013 | 12882 | 18973 |
| 2014 | 17662 | 25530 |
| 2015 | 9046 |
Interviews were conducted with Canadian Grain Commission staff and management, producer and industry associations, domestic grain companies and buyers, and international buyers and processors of Canadian grains and oilseeds. These interviews indicated that all external beneficiary groups use the reports and information, but that international end users have a more significant demand for the information than domestic stakeholders. Domestic stakeholders primarily rely on their own sampling and analysis to inform their marketing strategies. All international buyers and processors interviewed are familiar or somewhat familiar with the reports and information and 94% use them; 94% of domestic producer and industry associations are very familiar with the reports and information and 63% use them; and 71% of domestic grain companies interviewed are somewhat familiar or familiar with the reports and information and 62% use them.
Producer associations and grain companies that do not use the reports commonly explained that they were unaware the reports were available to them or they rely on another source of quality information. A few representatives of associations stated that the contents were not relevant to their specific role, or their informational needs.
Perceived usefulness of the Canadian Grain Commission annual harvest quality reports
All of the 16 international buyers and processors interviewed that use the Canadian Grain Commission’s annual harvest quality reports reported that they find them useful or very useful (an average rating of 4.7 out of 5) and that the reports contain information on grading and quality that is relevant and beneficial in supporting their decision-making. International buyers and processors use the information to support their purchasing decisions, such as by identifying which growing regions have their desired quality and providing necessary information on protein strength to support their end use functionality. Some also use the information to inform their processing decisions, such as when planning for corrections in their flour recipes in order to mitigate the impact of changes in key quality parameters.
The 11 producer and industry associations interviewed that use the reports find them useful (an average rating of 4.2 out of 5). Associations most frequently use the reports to obtain a good understanding of the national supply and the quality attributes of the crop year, and to compare data across years and regions. Similarly, most domestic grain companies find the reports and information useful (an average rating of 4.2 out of 5). Mills, grain buyers and traders perceive the information to be slightly more useful than terminals and processors. The grain companies reported that they use the region-specific data on grain quality and grading to compare the Canadian Grain Commission’s results to the harvest quality results within their region and other regions, and to the results of their own quality surveys and testing or those of mills they purchase flour from.
Canadian Grain Commission staff and management reported that there is a stronger awareness and understanding of the Canadian Grain Commission and the harvest quality reports and information among international buyers than domestic beneficiaries. Staff and management indicated that greater communication with domestic producer associations is needed to educate domestic beneficiaries on the benefits of the Harvest Sample Program. The most frequent suggestion for improving domestic beneficiaries’ awareness is greater communication with associations, including distribution of the harvest quality reports via email.
Increased need for Harvest Sample Program outputs following the dismantling of the Canadian Wheat Board
As previously demonstrated, there has been increasing demand for the Harvest Sample Program outputs among external beneficiaries in recent years. The findings of the evaluation indicate this is the result of changes in the marketing of grains and oilseeds, and the transition from a single sales desk with the Canadian Wheat Board to an open market for western wheat and barley in 2012.
While the majority of participating producers (55%) reported that the usefulness of the Canadian Grain Commission’s unofficial grade and quality assessment has remained consistent, 29% explained that the unofficial grade has become more important or useful to them. These individuals most frequently explained (45%) that the open market has resulted in more complicated and subjective grading, making it more challenging for them to assess buyers’ offers and negotiate grade and price for their grain. As a consequence, they are more reliant on the use of an independent third-party assessment as a basis for comparison. Approximately 41% stated they now have a greater need for quality information to support their marketing efforts.
Similarly, a large majority (88%) of Canadian Grain Commission staff and management and more than half of associations and grain companies and buyers that use the reports (56% and 58%) claimed that the usefulness of the reports and information has increased. According to these stakeholders, changes in the marketing of wheat and other grains, and the introduction of an open market for western wheat and barley have contributed to an increased need for technical information on quality and end-use functionality among producers, associations, marketers and traders. Stakeholders responsible for marketing Canadian grains stated that they have a greater need for detailed information on quality and end-use functionality in order to identify markets, market effectively, and respond to buyers’ requests for information.
Some producer and industry associations reported having received increasingly complex and technical demands for information from buyers. This was said to be the result of an increased focus on specific characteristics affecting processing and end use functionality, such as falling number for wheat, and gluten strength and protein strength among specific varietals. As one association representative explained, “the grading factors and characteristics sought by buyers are evolving and vary according to commodity and intended end-use.” The introduction of new food safety legislation with maximum residue levels (MRLs) of mycotoxins, herbicides and pesticides was also identified as being a contributing factor to buyers’ increased need for information. These findings were supported by the comments of the international buyers and processors.
A review of industry news articles published since 2012 supports these findings. For example, a 2012 article by Alberta Agriculture and Forestry explains that producers are experiencing increased variability in the price spreads across wheat grades and protein levelsFootnote18. A 2015 AgCanada article reports that inconsistent grading from elevator companies has increased the importance of harvest quality information prior to deliveryFootnote19. Articles published by The Western ProducerFootnote20 in 2013 and the Globe and MailFootnote21 in 2014 suggest smaller producers experience greater difficulty handling their own marketing and financing, and producers face increased competition between farms, as consolidation within the industry has resulted in fewer grain buyers and less competition. The Western Producer article argues that domination of the prairie grain industry by 3 major elevator companies has driven down price competition and reduced producers’ ability to negotiate price and grade.
Complementarity and overlap with similar programs and initiatives
Overall, the Harvest Sample Program complements harvest surveys undertaken by other organizations in Canada. While there does exist some overlap in the information provided by the Canadian Grain Commission’s annual harvest quality reports and Canadian International Grains Institute’s (Cigi) Harvest Assessment Report, differences in the sampling methodologies are complementary in that they benefit different stakeholders in the value chain. Differences in the scope of the surveys make both reports useful to end users for different reasons. The Grain Farmers of Ontario’s Ontario Wheat Harvest Quality Scoop, conducted in partnership with the Canadian Grain Commission as an extension of the Harvest Sample Program, is complementary. However, beginning in 2016, Grain Farmers of Ontario’s harvest survey will be conducted by the Ontario Grains Laboratory operated by SGS, possibly resulting in duplication or overlap with the Harvest Sample Program. Other sources of grading and assessment, such as grain companies and analytical labs, do not duplicate or overlap with the Harvest Sample Program, as they have a different purpose and do not publish harvest quality information. Almost all external beneficiaries use the Canadian Grain Commission’s outputs in addition to other sources of harvest quality information.
Complementarity and overlap with the Canadian International Grains Institute
Canadian International Grains Institute (Cigi) is a non-profit organization whose purpose is to:
- promote Canadian grain to global processors
- provide Canadian and international participants with training in Canadian grain and field crop production, marketing, distribution and processing
- provide Canadian industry participants with training to build knowledge of market characteristics and requirements
- identify unique end uses for Canadian grain and field crops through applied research
- operate facilities used to provide practical, commercially oriented knowledge to support a competitive Canadian grain and field crop value chain
The Canadian Grain Commission’s and Cigi’s missions, objectives and activities are largely complementary. The Canadian Grain Commission is mandated to establish and maintain standards of quality for Canadian grain and regulate grain handling in Canada to ensure a dependable commodity for domestic and export markets. It has the authority and responsibility to maintain standards for and regulate the handling of 20 grains grown in Canada to ensure Canada’s grain is safe, reliable and marketable, and Canadian grain producers are properly compensated for grain deliveries to licensed grain companies. Cigi is client-serving and is focused on marketing, innovation and adaptation. Cigi receives funding from Agriculture and Agri-Food Canada’s Agricultural Innovation and Marketing Program and Canadian Agricultural Adaptation Program to provide research services to domestic stakeholders. For example, Pulse Canada is currently undertaking a pulse milling project with Cigi using cost-matching from AAFC’s Canadian Cultural Adaptation Program. Beginning in fiscal year 2013 to 2014, Cigi has also conducted early generation testing on behalf of public wheat and durum breeders, and evaluated breeding lines for some private grain companies for varietal selection by the Prairie Grain Development CommitteeFootnote22.
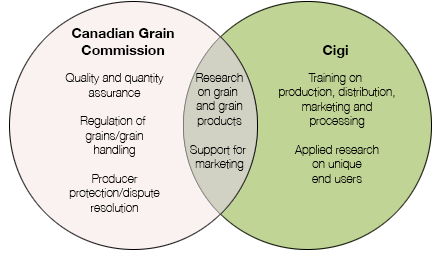
Cigi also provides technical expertise, experience and knowledge about the quality and end-use application of Canadian field crops to the Canadian value chain and international and domestic customers. Canadian Grain Commission and Cigi staff collaborate on joint research projects, inward trade missions for international buyers, outward Team Canada new crop missions and educational presentations to producers. Cigi has also supported the Canadian Grain Commission through use of their pasta drying equipment. Cigi’s Combine to Customer training and direct interaction with producers is useful in promoting the Harvest Sample Program and increasing awareness among producers. The purpose, objectives and activities of the Canadian Grain Commission and Cigi overlap in that both organizations provide support for the marketing of Canadian grains and oilseeds, and both conduct research on the end use application of grain and grain products (see Figure 5.7).
Figure 5.7: Canadian Grain Commission and Canadian International Grains Institute responsibilities
Details
| Canadian Grain Commission | Cigi | Overlap |
|---|---|---|
| Quality and quantity assurance | Training on production, distribution, marketing, and processing | Research on Grain and grain products |
| Regulation of grains/grain handling | Applied research on unique end users | Support for marketing |
| Producer protection/dispute resolution |
As part of its efforts to promote Canadian grain to global processors, Cigi conducts an annual Harvest Assessment Program in partnership with 9 major grain companies in CanadaFootnote23. The survey and report include representative samples of Canada Western Red Spring, Canada Western Amber Durum, Canada Western Red Winter and Canada Prairie Spring Red. Samples of commercial shipments by wheat class and grade (and region for Canada Western Red Spring) are obtained from inland elevators across Western Canada. Regional composites (western and eastern) are only available for Canada Western Red Spring; the other classes are prairie composites because they are not grown across all regions of the prairies. Cigi shares results with each individual grain company, and publishes the composite harvest quality results free of charge in an annual Quality of Wheat Classes report made available on Cigi’s website. The results are also shared at Team Canada new crop missions in November and December with domestic and international buyers of Canadian grain.
The comparative analysis and interviews with Canadian Grain Commission representatives provide evidence that Cigi’s program and report both overlap and complement the Harvest Sample Program and Canadian Grain Commission’s annual harvest quality reports. Both programs are designed to take representative samples of each harvest year’s crop and produce quality data on composite samples to share with industry and grain customers around the world to support the marketing of Canadian grain. Both reports can be accessed online at no cost, and are shared with customers at domestic and international new crop missions that include Cereals Canada, Cigi and the Canadian Grain Commission. The end users of the reports overlap, as domestic grain companies and buyers, associations and international buyers and processors use both Cigi and Canadian Grain Commission reports and data.
Differences in the sampling methodologies are complementary in that they benefit different stakeholders in the value chain. Whereas Cigi partners with 9 major grain companies to obtain samples and provides them with grading information to support their marketing strategy, the Harvest Sample Program sources directly from producers and provides them with unofficial grades that are used to inform their marketing strategies and assist them when negotiating a grade and price for their grain.
Differences in scope of the surveys and reports are also complementary. Cigi’s annual assessment and report includes only Canada Western Red Spring, Canada Western Amber Durum, Canada Western Red Winter and Canada Prairie Spring Red from the Prairie region. In addition to these 4 classes, the Canadian Grain Commission publishes harvest quality reports on other western Canadian wheat classes, wheat exports, flaxseed, lentils, malting barley and peas, Ontario wheat, and Canadian non-food grade soybeans and food-grade soybeansFootnote24.
Because Canada Western Amber Durum, Canada Western Red Spring, Canada Prairie Red Spring and Canada Western Red Winter are included in both reports, there is overlap in some of the quality data reported. Cigi and the Canadian Grain Commission conduct most of the same quality testing for these 4 wheat classes, but use different sampling methodologies. These distinct sampling methodologies can result in differences, which can lead to confusion or concern among external beneficiaries, particularly international buyers. As an illustration, the following table compares the quality parameters of No. 1 Canada Western Amber Durum reported by Cigi and the Canadian Grain Commission in their 2015 annual harvest quality reports.
| Quality parameter | Cigi | Canadian Grain Commission | Quality parameter | Cigi | Canadian Grain Commission |
|---|---|---|---|---|---|
| Wheat | Alveogram | ||||
| Test Weight, kg/hL | 82.2 | 81.9 | P, mm | 71 | 74 |
| 1000 kernel weight | 40.6 | 42.4 | L, mm | 75 | 96 |
| Hard vitreous kernels, % (HVK) | 95 | 95 | P/L | 0.95 | 0.77 |
| Protein, % | 13.8 | 13.8 | W, x10 -4joules | 169 | 204 |
| Protein (dry matter basis), % | 16.0 | N/A | Granulation | ||
| Falling number, s | 435 | 420 | Over 30 US (590 mic) % | 0.0 | N/A |
| Ash % | 1.48 | 1.52 | Over 40 US (420 mic) % | 2.3 | N/A |
| Particle size index, % | 29.7 | N/A | Over 60 US (250 mic) % | 51.4 | N/A |
| Milling yield | Over 80 US (177 mic) % | 25.3 | N/A | ||
| Yield, % | 69.9 | 74.7 | Over 100 US (149 mic) % | 8.2 | N/A |
| Semolina yield, % | N/A | 66.5 | Thrus 100 US % | 12.8 | N/A |
| Semolina | Spaghetti colour dried at 85oC | ||||
| Protein, % | 12.7 | 12.9 | Colour - L (brightness) | 71.0 | 72.8 |
| Protein loss on milling, % | 1.1 | N/A | Colour - a (redness) | 5.97 | 5.1 |
| Wet gluten, % | 34.9 | 34.5 | Colour - b (yellowness) | 59.5 | 63.7 |
| Gluten index, % | 50 | N/A | Spaghetti texture | ||
| Ash, % | 0.71 | 0.66 | Firmness (9 min cooking time), g | 716 | N/A |
| Colour L, (brightness) % | 84.8 | N/A | Cooking loss, % | 5.0 | N/A |
| Colour a, (redness) % | -3.06 | N/A | Cooked weight/initial weight | 3.2 | N/A |
| Colour b, (yellowness) % | 28.8 | 32.5 | Peak cutting force, g | N/A | 632 |
| Yellow pigment content, ppm | 9.6 | 9.8 | Dry strand diameter, mm | N/A | 1.69 |
| Speck count | Cooked strand diameter, mm | 2.50 | |||
| Total per 50 cm2 | 28 | 19 | |||
| Dark specs | N/A | 2 | |||
| Large specks (0.6 mm2) | N/A | 9 | |||
There are differences in both organizations’ reporting of the 4 wheat classes, which make both reports useful to end users of the information. The Canadian Grain Commission reports provide a more nuanced breakdown of the quality parameters by crop region, and facilitate a year to year historical comparison. For example, Cigi reports quality parameters for overall No. 1, No. 2 and No. 3 composites only with the exception of Canada Western Red Spring, which is separated into western and eastern Prairie composites. In comparison, the Canadian Grain Commission reports quality parameters for No. 1, No. 2 and No. 3 composites by growing region and reports protein content by grade and province and grade and region.Footnote25 For Canada Western Red Spring, the Canadian Grain Commission also develops composite samples according to the following protein segregates, which is beneficial to buyers.
- Wheat, No. 1 Canada Western Red Spring - 14.5% protein segregate
- Wheat, No. 1 Canada Western Red Spring - 13.5% protein segregate
- Wheat, No. 2 Canada Western Red Spring - 14.5% protein segregate
- Wheat, No. 2 Canada Western Red Spring - 13.5% protein segregate
- Wheat, No. 3 Canada Western Red Spring - no protein segregate
Almost all Canadian Grain Commission staff and management (95%) perceive Cigi’s Harvest Assessment Program as conducting similar activities and having similar objectives to the Harvest Sample Program. A large majority (89%) stated that there is duplication or overlap between the Canadian Grain Commission and Cigi in supporting the marketing of Canadian grains and oilseeds. Canadian Grain Commission representatives suggested the roles of the 2 organizations need to be better defined, and the harvest results need to be shared with international end users in a way that is complementary. One quarter of representatives (26%) suggested that Cigi and the Canadian Grain Commission should establish a means of sharing sample materials in order to ensure harmonious data and a consistent approach. Some Canadian Grain Commission representatives (18%) explained that better branding and differentiation of the 2 organizations is needed to ensure industry recognizes that Cigi is the expert in international marketing and the Canadian Grain Commission is the expert in quality and quantity assurance.
In general, external beneficiaries are more likely to perceive the 2 organizations’ activities as complementary, and to find both sources of information useful. Only one of the producer and industry associations and 40% of domestic grain companies and buyers identified the 2 organizations as conducting similar activities and having similar objectives. The domestic grain companies generally perceive the 2 to be complementary, citing Cigi’s different sampling methodology and use of different milling equipment. Similarly, almost three-quarters of the international buyers and processors interviewed (73%) suggest they rely on both the Canadian Grain Commission and Cigi’s reports and find both sources of information useful, citing their different sampling methodologies and focus. Of the other 4 respondents, 3 relied exclusively on Canadian Grain Commission annual harvest quality reports and 1 relied on Cigi reports exclusively.
One producer association and 4 international buyers and processors stated that the publication of 2 Canadian harvest quality reports is confusing or unnecessary. These individuals suggested that Cigi and the Canadian Grain Commission could do a better job of coordinating the report to produce one final comprehensive report. Among the 4 international buyers, 2 had no expressed preference for which sampling methodology be used to prepare the report and 1 suggested Canada should integrate the 2 sampling methodologies. The fourth international buyer believed it is very important that the samples be obtained at the producer level to allow for greater identification of strengths and weaknesses in growing regions.
Complementarity with Grain Farmers of Ontario Quality Scoop Report
To date, Grain Farmers of Ontario’s harvest survey activities have been complementary to the Harvest Sample Program. A few (4%) Canadian Grain Commission staff and management explained that Grain Farmers of Ontario conducts their own harvest survey on samples grown in plots, and that the small scope and different sampling methodology do not overlap with the Harvest Sample ProgramFootnote26. Program documents and the comparative analysis also indicate that Grain Farmers of Ontario has partnered with the Canadian Grain Commission since 2010 to collect samples of Canada Eastern Soft Red Winter, Canada Eastern Soft White Winter and Canada Eastern Hard Red Winter wheat directly from grain companies across Ontario as part of the Harvest Sample ProgramFootnote27. The harvest quality report is published on the Canadian Grain Commission website, as well as in Grain Farmers of Ontario’s annual Ontario Quality Scoop Report, which is available free of charge on their website. This partnership is complementary; Grain Farmers of Ontario facilitates the collection of Eastern Region samples for the Harvest Sample Program and the publication of the results on the Grain Farmers of Ontario website encourages more widespread use of the information.
Even with Grain Farmers of Ontario’s collection of Eastern Region samples, the Canadian Grain Commission has been challenged obtaining sufficient harvest samples from producers of the more prevalent eastern grain crops in order to provide meaningful results on a timely basis. It may be necessary for the Canadian Grain Commission to enhance its relationship with Grain Farmers of Ontario and other eastern region organizations to enhance the Harvest Sample Program for those grains.
Complementarity with grain companies, analytical labs and third-party testers
Key informant interviews and surveys of participating producers show that most grain companies do their own harvest survey and sampling, but there is no risk of duplication or overlap. Their methodology and focus differs from the Canadian Grain Commission and their results are not shared publicly. In addition to the Canadian Grain Commission’s harvest quality data and information, almost all producer associations and domestic grain companies use analyses conducted by grain companies, and some use analyses conducted by independent analytical labs. According to these representatives, they use the Canadian Grain Commission reports to complete their understanding of the crop year quality and as a comparison, but ultimately rely on grain companies’ testing of the exact factors they require for their intended end use/functionality.
Similarly, almost all producers who obtain Harvest Sample Program unofficial grades (93%) also obtain grades from grain companies, and 15% obtain official grades from private labs or third party sources. Producers use the Canadian Grain Commission unofficial grades to compare against buyers’ grades and assessments, and typically only use analytical labs or third-party providers to obtain a more detailed analysis and technical factors which are not included in the Harvest Sample Program unofficial grade.
Performance
Effectiveness in achieving intended outcomes
The following section assesses the performance of the Harvest Sample Program in terms of the extent to which the program achieves its intended outcomes, demonstrates efficiency and economy, and the relevance of its design and delivery.
Immediate outcomes
The program is very successful in achieving its immediate outcomes, which are to:
- support the activities of the Quality Assurance Program and Grain Quality Research Program through the provision of sample materials
- increase producers’ knowledge of their grain quality
- increase awareness among domestic and international buyers and processors of the quality of Canadian grain crops
Program beneficiaries are very satisfied with the program overall.
Effectiveness of the Harvest Sample Program in supporting the activities of the Quality Assurance Program and Grain Quality Research Program
All Canadian Grain Commission representatives reported that the Harvest Sample Program has a major impact in terms of supporting the activities of the Quality Assurance Program and Grain Quality Research Program (an average rating of 4.6, out of 5). According to staff and managers, the Harvest Sample Program is the only source of suitable sample materials (60%). Staff and managers also reported that the materials are useful in developing grading standards (40%), provide a good representation of grains and access to unadulterated producer samples (32%), and allow for long-term monitoring of grades and assessment of grading factors (32%).
Program documents provide evidence that the Harvest Sample Program helps the Canadian Grain Commission fulfill its federally mandated responsibilities by providing an annual source of unblended producer samples which maximizes the range of varieties, environmental factors, and quality characteristics. The analyses of the processing and end-use qualities of the sample materials are used to inform the definitions and tolerances within Canada’s grain grading system, such as the development and monitoring of operational near infrared (NIR) calibrations and moisture charts, and the ongoing development of laboratory-based methods for assessing grain quality. The samples are also used to identify and source materials containing specific grading factors required for standard sample preparation. These standard samples are subsequently used across Canada to support consistent visual grading and inspection. Lastly, the Harvest Sample Program is the primary or most comprehensive source of materials for much of the research conducted by the Grain Quality Research Program. The collection of pure, farm-level samples that have not been blended, and for which the geographical sources are known and diverse, makes the resulting materials different, and in some instances, preferable to cargo shipment samples, varietal breeder samples, or composite samples obtained from elevators, associations or other stakeholders.
The annual harvest quality reports and information generated using the program samples also support the Canadian Grain Commission’s obligation to implement a system of grading that meets the need for efficient marketing in and outside of Canada. The unofficial grade and assessment provided to participating producers at no charge gives them quality information that can inform their marketing strategy. Additionally, the distribution of the unbiased, third-party harvest quality results, generated using samples from all growing regions in Canada, helps ensure the resulting harvest quality information is considered by producers, handlers, marketers and end-users to be an accurate overall assessment of the quality of grain grown in a given year, taking into account varietal and environmental variability. The use of the harvest quality reports as an early indicator of the predominant grading factors and quality issues for a given crop year enables the Canadian Grain Commission and the grain industry to develop and implement pre-emptive strategies to mitigate the impact of these factors, and to communicate these strategies with buyers and end-users. Analysis of the program samples includes quality characteristics which are important to buyers but not reflected in the numerical grade, such as milling yield and farinograph absorption. This is becoming more vital to the effective marketing of Canadian grains, as purchase decisions are increasingly influenced by subtle differences that have implications on processing quality.
To better support the activities and objectives of the Quality Assurance Program and the Grain Quality Research Program, Canadian Grain Commission representatives suggested the Harvest Sample Program needs greater control over the type and quantity of material sent by producers in order to ensure the Canadian Grain Commission receives an adequate number of samples which are representative/statistically sound (65%). Suggestions include changing the sample envelopes to allow for reporting of acreage/tonnage, increasing promotion of the program and including additional testing and quality information for producers such as dockage, grading factors and starch testing for pulses.
Producers’ increased knowledge of their grain quality to better market their grain
Almost all surveyed participating producers (90%) reported that the unofficial grades and quality information they receive as part of the Harvest Sample Program are useful or very useful in providing them with increased knowledge to better market their grain (an average rating of 4 out of 5). Producers explained that the Canadian Grain Commission’s unofficial grade helps them to gain a better understanding of the quality of their grain before submitting samples to potential buyers, which assists them in making educated assessments of the offers they receive from prospective buyers (62%).
Approximately 18% of producers use the knowledge they receive from the unofficial grade to identify the most suitable markets for their grain and develop an appropriate marketing strategy. For example, producers use the information to better understand who their buyer is (e.g. feed mills versus an elevator) and their best strategy for marketing (e.g. futures contracts for high grade flour, on-farm blending or targeting buyers interested in blending). Some producers suggested this is most valuable to them when their commodity is significantly downgraded and they are forced to seek out alternative markets.
The small minority (8%) of producers who do not find the Harvest Sample Program results useful in marketing their grain most frequently indicated that their buyers set the grade and price based on their own testing (17%), the results are not timely enough (17%), the Canadian Grain Commission grades are unofficial (12%) or they have not needed the results (12%). A number of producers (13%) noted they did not receive the results, which may indicate a lack of understanding of the program results reporting process (i.e. producers mistakenly believe the results will be emailed or mailed to them or were unable to login to retrieve their results).
On average, the usefulness of the unofficial grade and information to producers is less understood by domestic stakeholders. Producer and industry associations that use the reports expect the Harvest Sample Program’s unofficial grade to be somewhat helpful to helpful to producers (an average rating of 3.5 out of 5) and associations that do not use the Canadian Grain Commission’s reports expect the unofficial grade to be only somewhat useful (an average rating of 2.8 out of 5). While domestic stakeholders believe the free, unbiased grade must be at least somewhat useful in providing producers with increased knowledge of their grain quality, some producer and industry associations note that the utility depends on producer participation and the soundness of the producers’ sampling methodology. A few associations stated that the unofficial grade and results are missing key characteristics such fusarium and falling number for wheat and specific end-use processing characteristics for lentils and food-grade soybeans, and that the grade is not timely enough to meet the producers’ marketing needs, particularly for commodities which are marketed immediately after harvest such as pulses, beans and peas.
Effectiveness in providing stakeholders with better information on the Canadian grain crop
All international buyers and processors of Canadian grain stated that the information produced by the Harvest Sample Program is useful or very useful in helping them make informed business decisions (an average rating of 4.6 out of 5). Almost all respondents (92%) explained that they rely on the protein information and details on quality distribution and growing regions included in the Canadian Grain Commission’s annual harvest quality reports to make purchasing decisions. A third (33%) suggested they rely on the information to inform their processing, such as by adjusting their own blending and milling recipes based on the reports. They may also rely on the reports when informing their customers of changes in quality that may impact processing or end-use functionality.
Producer and industry associations that use the Canadian Grain Commission harvest quality reports also find them very useful in making informed business decisions (average ratings of 4.5 out of 5). Most perceive the reports and information to be very important to buyers, particularly international customers. They suggest that evidence of Canada’s higher protein, lower insect problems, higher oil content and overall quality and consistency is crucial to Canada’s ability to compete with other major grain-exporting countries. Domestic grain companies and buyers also stated that the harvest quality reports and information are useful (an average rating of 4.1 out of 5). Most of the grain companies and buyers (60%) indicated that the reports provide a good indicator of the overall quality. Most use it as a benchmark for comparison and rely primarily on other sources of harvest quality information, but believe it is important to international buyers and a useful tool for building trust.
Some key informants reported that the harvest quality information is far more useful for wheat, canola and amber durum than for food-grade soybeans. According to these key informants, the comparatively small number of soybean buyers purchase specific food-grade soybean varietals by shipping container. Purchase arrangements are often arranged as futures, wherein producers are contracted to grow specific acres of a particular soybean varietal for a buyer. Key informants suggested that Canadian Grain Commission grades for soybeans are not relevant to buyers, because they are grade specific not varietal specific, and because they do not contain information on specific functional characteristics desired for processing and end-uses such as tofu, soymilk and unprocessed adult beans. Examples of functional characteristics sought by buyers include the ability of the soybean proteins to thicken (viscosity), emulsify, form gels, foam, produce films and sulphur, absorb water and/or fat and create meat-like texturized structuresFootnote28. Other key informants stated that the non-GMO soybean market relies on their own testing and analysis. For the Canadian Grain Commission’s grading and harvest quality information to be more useful to soybean buyers, key informants suggested there would need to be a sufficient number of samples to support analyses by intended end use, rather than the current differentiation between food-grade and crushed beans. It was noted this may not be feasible or desirable, since soybean buyers have their own labs and conduct their own required analysis.
Almost all of the Canadian Grain Commission representatives interviewed (92%) stated that the Harvest Sample Program is useful or very useful in providing external stakeholders with better information on the Canadian grain crop to make informed business decisions. The majority of representatives (72%) stated the information is very important for supporting international buyers in their purchasing and processing decisions. Examples provided include customers’ use of Canadian Grain Commission quality reports to compare with North Dakota and the use of Canadian Grain Commission historical data to compare against weather patterns to formulate earlier crop quality predictions.
If the harvest quality reports and information were not publicly available to interested stakeholders, Canadian Grain Commission representatives indicated that there would be many more unknowns with regards to Canadian crop quality (33%) and buyers would face increased risk and costs as they would have to invest more in their own testing and analysis (33%). Some representatives (20%) suggested the increased risk could lead to lower commodity prices.
Intermediate outcomes
The Harvest Sample Program has been successful in achieving its intermediate outcomes, which are to:
- improve producers’ ability to negotiate a price and grade for their grain
- increase stakeholders’ confidence in the quality, grading factors and specifications of the Canadian grain crop
- provide information that assists the domestic grain industry in marketing Canadian grains
Effectiveness of the Harvest Sample Program in helping producers negotiate grade and price for their grain
Half of participating producers (50%) find the unofficial grade useful or very useful in helping them negotiate grade and price for their grain and 31% find it somewhat useful (an average rating of 3.6 out of 5). The majority of producers (52%) suggested that, although grain buyers may not recognize and accept the Canadian Grain Commission’s unofficial grade, they are able to use the unofficial grade as a benchmark for comparison and solicit offers from multiple buyers in the instance of a discrepancy. Nearly a quarter of producers (22%) do use the unofficial grade as leverage when negotiating with buyers and explained that the results give them the confidence to appeal when the offer presented to them is lower than the grade provided by the Harvest Sample Program. Among these producers, a quarter reported that buyers usually defer to the Canadian Grain Commission grade in the case of a discrepancy. For example, one producer received a protein assessment of 13.9% from the Canadian Grain Commission and 12.3% from the buyer, resulting in a price difference of $0.45 per bushel. After seeing the Canadian Grain Commission results, the buyer retested the grain and paid for the grain based on the higher protein level.
Lastly, some producers (10%) indicated that, by helping them identify how best to market their grain and target buyers that would be the most interested, the unofficial grade and information helps them obtain the best price for their grain.
Producers who stated that the Harvest Sample Program results are not useful in helping negotiate grade and price reported that buyers set the grade and price following their own testing and analysis (43%), and the usefulness of the program results is limited by the fact that they are unofficial (15%). Some producers have not needed to use the results, as they have not experienced any discrepancies with their buyers’ assessments (21%). When asked if there are other reasons why the program is not useful, about a third of producers (33%) noted that they need more detailed grade and analysis information (e.g. grading factors, dockage, vomitoxin, diseases, protein, hard vitreous kernels (HVK), moisture, falling #, genetically modified organisms for flax, bushel weight, bleached percentage for peas, and green seed versus parts per million chlorophyll for canola).
Effectiveness of the Harvest Sample Program in increasing information recipients’ confidence in the quality, grading factors and specification of the Canadian grain crop
Almost all international buyers and processors of Canadian grains stated that the information produced by the Canadian Grain Commission has had an impact or a significant impact in increasing their confidence in the quality, grading factors and specifications of Canadian grain (average rating of 4.5). According to these individuals, high levels of confidence in the quality and consistency of Canadian grain is one of the primary reasons they purchase from Canada, and the modernization of Canada’s wheat classification system will result in further improvements in quality. A couple of international buyers suggested that genetics and varietal specific information are becoming increasingly important relative to some of the current grading factors.
Canadian Grain Commission representatives indicated that the Harvest Sample Program has had a major impact in terms of increasing confidence among external stakeholders in the quality, grading factors, and specifications of the Canadian grain crop (an average rating of 4.9 out of 5). Similarly, representatives from the producer and industry associations, domestic grain companies and buyers reported that the information produced by the program has been useful or very useful in terms of increasing confidence among stakeholders (average ratings of 4.4 and 4.3 out of 5, respectively). Canadian Grain Commission representatives stated that the harvest quality reports increase stakeholders’ confidence by providing historical data that shows the consistency of Canadian grain year over year. The fact that the Canadian Grain Commission is an independent government agency was also said to help instill confidence in the autonomy and validity of the Canadian grading system and the annual harvest reports. Representatives of domestic associations and grain companies indicated that the information is very valuable for their interactions with international buyers, as international stakeholders value the Canadian Grain Commission as an independent, reliable, third-party source of information on harvest quality, particularly following the termination of the Canadian Wheat Board monopoly.
The findings of a 2010 Ipsos Reid survey of Canadian grain and oilseed producers conducted on behalf of the Canadian Grain Commission indicate that 95% of producers believe that having the Canadian Grain Commission set grain grades and standards helps to uphold Canada’s reputation for consistent and reliable grain qualityFootnote29.
Effectiveness of the Harvest Sample Program in assisting the domestic grain industry in marketing Canadian grain
All of the international buyers and processors who commented perceive the information produced by the Harvest Sample Program as useful or very useful in assisting the marketing Canadian grains (an average of 4.9 out of 5). Respondents explained that Canada’s greatest selling factor and competitive advantage as compared to other grain exporting countries is its high quality and consistency. Some international buyers commented that the information produced by the Canadian Grain Commission is comparable to the information produced by the United States, and that if Canada did not produce similar reports and attend new crop missions, Canada would be at a distinct disadvantage.
All of the Canadian Grain Commission representatives stated that the program has had a very significant impact (60%) or some impact (20%) in assisting the domestic grain industry in marketing Canadian grain (an average rating of 4.2 out of 5). Representatives reported that grain companies are becoming more aware of the importance of the data (36%), and that domestic stakeholders such as canola crushers and producer associations are making requests for additional quality data to help inform their marketing strategies (21%). For example, in recent years, the Canadian Grain Commission has received:
- requests from Grain Farmers of Ontario and Bean Farmers’ of Ontario for detailed information on wheat, beans and soybeans
- a request from canola crushers for information on oil content by variety
- a request from Pulse Canada for research on the functional properties and nutritional value of pulses to support new marketing strategies
Some representatives commented that additional efforts are required by the Canadian Grain Commission to work with domestic stakeholders to educate them on the informational needs of buyers and processors.
Canadian producer and industry associations, grain companies and buyers generally found the information produced by the Harvest Sample Program useful in assisting the domestic grain industry to market Canadian grain (average ratings of 4.4 and 4.1 out of 5, respectively). Respondents explained that the Canadian Grain Commission’s reputation as an unbiased source of information, and its national collection of grain samples, make the information very useful. All key informants agreed that the information is very valuable in assisting the grain industry in marketing Canadian grain in international markets, highlighting the Canadian Grain Commission’s dissemination of the harvest quality reports and information to buyers during inward and outward trade missions.
End outcomes
The Harvest Sample Program is effective in supporting the achievement of the Canadian Grain Commission’s strategic outcome to ensure that “Canada’s grain is safe, reliable and marketable and Canadian grain producers are properly compensated for grain deliveries to licensed grain companies.” As described previously, the program is successful in supporting the legislated responsibilities of the Canadian Grain Commission to recommend and establish grain grades and standards, implement a system of grading and inspection for Canadian grain that meets the need for efficient marketing in and outside Canada, and undertake, sponsor and promote research in relation to grain and grain products. The unofficial grades are used by participating producers to inform their marketing strategies and to negotiate a price for their grain. The Canadian Grain Commission’s annual harvest quality reports are widely used by interested stakeholders to support the marketing of Canadian grains and oilseeds.
Efficiency and economy
The Harvest Sample Program makes efficient use of staff and other resources. The cost of mailing sample kits to non-participating registered producers, many of whom have retired, relocated or are deceased, is negatively affecting the program’s efficiency. Further measures to identify and remove inactive registrants and increase producer registration and participation would improve the program’s efficiency and economy.
Program expenditures
The design of the program is efficient and cost-effective. With the exception of the term staff hired to prepare the sample mail outs, the program shares its human resources with the Grain Research Laboratory, the Industry Services Division and the Internal Services program. While a total of $750,000 is annually allocated to the completion of the program, it has no fixed budget. Program expenditures fluctuate based on the number of samples received and the extent and types of analysis conducted each harvest, which may vary based on the presence and severity of grading factors and the occurrence of flooding. Each harvest year also has one or more designated areas of focus where additional, more detailed analysis is conducted for a particular crop, milling technique, or other factor. As shown in Table 5.9, program expenditures averaged approximately $660,000 over the last 5 years but ranged from a low of $512,364 in the 2011 to 2012 fiscal year to a high of $835,481 in the 2012 to 2013 fiscal year. Most variances in program expenditures are the result of differences in salary expenditures resulting from the:
- level of effort required to process, grade and analyze fluctuating numbers of sample submissions
- level of effort associated with varying crop quality
- number of special research projects undertaken
| Expenses | 2010 to 2011 | 2011 to 2012 | 2012 to 2013 | 2013 to 2014 | 2014 to 2015 |
|---|---|---|---|---|---|
| Total operating expenses | $98,758 | $106,141 | $78,111 | $82,935 | $66,758 |
| As a % of total | 13% | 21% | 9% | 15% | 10% |
| Total salary expenses | $670,324 | $406,223 | $757,369 | $458,488 | $581,559 |
| As a % of total | 87% | 79% | 91% | 85% | 90% |
| Total expenses | $769,083 | $512,364 | $835,481 | $541,424 | $648,317 |
Source: Harvest Sample Program Year To Date expense reports, 2010/11 to 2014/15
The following table depicts the average cost per sample submitted, based on the total program expenses for years 2010 to 2014.
| Expenses | 2010 to 2011 | 2011 to 2012 | 2012 to 2013 | 2013 to 2014 | 2014 to 2015 |
|---|---|---|---|---|---|
| Total expenses | $769,083 | $512,364 | $835,481 | $541,424 | $648,317 |
| Samples submitted | 8,755 | 7,197 | 7,495 | 5,698 | 9,389 |
| Cost per sample | $87.85 | $71.19 | $111.47 | $95.02 | $69.05 |
Canadian Grain Commission staff and management perceived the program to be cost-efficient in achieving its expected outputs and outcomes (an average rating of 4.1 out of 5). Representatives commented that the Harvest Sample Program achieves a lot in a very limited timeframe with limited staff resources (25%) and the program does a good job of utilizing casual staff to keep labour costs down (15%). Almost three-quarters (72%) of staff and managers stated that the current design is the most efficient and cost-effective option, and 56% noted that the current process of collecting samples directly from producers is the most efficient and cost-effective method used by the Canadian Grain Commission thus far.
Inefficiencies resulting from inactive registered producers
As producers registered for the Harvest Sample Program are disproportionately older than the farming community, the cost of mailing sample kits to non-participating registered producers who have retired, relocated or are deceased negatively impacts the efficiency of the program. As shown in the following figure, the average overall response rate of all registered producers has declined from 45.3% in 2011 to 29.5% in 2014.
Figure 5.11: overall response rate by region, 2011 to 2014

Details
| Region | 2011 | 2012 | 2013 | 2014 |
|---|---|---|---|---|
| Eastern | 31.8% | 25.7% | 9.3% | 13.6% |
| Western | 45.3% | 36.2% | 23.2% | 29.5% |
| All producers | 41.1% | 33.0% | 18.9% | 24.6% |
The Canadian Grain Commission has taken steps to address the declining response rate. In 2015, 2,572 producers that had not submitted a sample during the past 3 years were removed from the database, resulting in a net savings of over $10,000. Given that almost 73% of surveyed participants were aged 51 and older, and 53% were 64 and older, continued efforts to identify and reduce inactive registrants and recruit younger producers will be needed going forward.
There are also significant differences in the average response rate by commodity, as shown in the following figure. A full breakdown of the response rate by commodity and by year is provided in Appendix 4. Further efforts to enable producers to select which commodities they receive sample envelopes for may help to reduce the number of unused sample envelopes mailed to participating producers.
Figure 5.12: average response rate by commodity, 2011 to 2014

Details
| Commodity | Percentage from 2011 to 2014 |
|---|---|
| Soybeans | 14.6% |
| Peas | 48.3% |
| Peabeans | 49.8% |
| Mustard | 21.3% |
| Lentils | 84.6% |
| Flax | 18.5% |
| CWSWS | 32.8% |
| CWRW | 34.2% |
| CWRS | 47.7% |
| CWHWS | 9.3% |
| CWGP | 48.0% |
| CWES | 7.8% |
| CWAD | 47.0% |
| CPSW | 9.9% |
| CPSRCPSR | 20.9% |
| Chickpeas | 22.1% |
| CEWW | 20.2% |
| CESRW | 20.9% |
| CERW | 27.6%% |
| CERS | 20.4% |
| Canola | 26.9% |
| Beans | 20.4% |
Program design and delivery
The current program design is the most suitable based on the needs of the program’s beneficiaries. Identified alternative sampling methodologies would not meet the Canadian Grain Commission’s internal program needs for unadulterated producer level samples, would not assist producers in marketing their grains and negotiating grade and price, or would be cost-prohibitive. Transitioning the Harvest Sample Program to a fee-for-service program would result in very significant declines in producer participation, resulting in an inability to meet the internal needs of the Canadian Grain Commission and the needs of external program beneficiaries. While beneficiaries are satisfied overall with the design and delivery of the program, the evaluation identified opportunities to further enhance the program.
Program designs utilized by other jurisdictions
The comparative analysis of harvest surveys and annual harvest quality reports produced by competitor countries (i.e. the US, Australia, France and the United Kingdom) did not identify viable alternative designs for the Harvest Sample Program. The sampling methodologies employed for the US Wheat Associates’ Annual Harvest Quality Survey and Reports and France’s Agrimer and Arvalis’ Annual Harvest Survey and Quality of French Wheat Report involve collecting composite samples from inland elevators. This methodology would not meet Canadian Grain Commission program managers and scientists’ needs for unadulterated producer level samples, would not assist producers in marketing their grains and negotiating grade and price, and would duplicate Cigi’s sampling methodology, leading to competition for samples between the 2 organizations in the Prairie region.
Two of the programs examined in the comparative analysis included designs that sample directly from producers and could provide producers the same information they receive under the Harvest Sample Program. The first, the Australian Export Grains Innovation Centre’s (AEGIC) Australian Wheat Quality Report, is modelled after the Harvest Sample Program. The Australian Export Grains Innovation Centre partners with the producer association Grain Growers to obtain samples directly from producers using mail-in sample bags. Unlike the Harvest Sample Program, producers are required to pay the return postage for their harvest samples. To date, this program has been unsuccessful in obtaining a comparable number of samples to the Harvest Sample Program (in 2015 they received only 1,000 samples). Their requirement that producers pay the return postage on their sample submissions would lead to significant declines in Harvest Sample Program participation. The second program is operated by the Great Plains Analytical Laboratory in the US. Participants are charged a subscription fee and are visited by travelling field representatives who collect the samples directly. In exchange, participants receive access to the private results of the analysis. As few surveyed Harvest Sample Program participants are currently willing to pay for analytical testing, and most participants reported that they would no longer participate if the program were a fee-based service, the paid subscription model does not present a viable alternative program design.
A comparative program that obtains samples exclusively from analytical laboratories is operated by the Cereals and Oilseeds Division of the Agriculture and Horticulture Development Board in the United Kingdom. The Cereals and Oilseeds Division produces a regular Cereal Quality Survey Results Report based on the samples collected from analytical laboratories. As most major grain companies in Canada conduct their own lab analysis, and very few producers submit paid samples to analytical laboratories (only 69 of 1,168 surveyed Harvest Sample Program participants surveyed submit samples to analytical laboratories and 104 submit samples to third-party service providers), this would not result in a sufficient number of samples to support the internal needs of the Canadian Grain Commission or the needs of external beneficiaries.
While none of the similar programs identified in competitor jurisdictions provided viable alternative program designs, some best practices or lessons learned were identified.
The US Wheat Associates’ practice of updating the online harvest quality data every Friday as samples are received and analyzed during harvest season (May to October) enables buyers and interested stakeholders to know exactly when to visit the webpage to obtain the most up-to-date harvest information. The US Wheat Associates’ and the UK’s Agriculture and Horticulture Development Board’s Cereals and Oilseeds Division’s partnerships with analytical laboratories to collect sample materials suggests another possible supplemental source of sample materials for the Harvest Sample Program.
The Australian Export Grains Innovation Centre’s practice of linking producers’ sample submissions to the represented tonnage allows for a more accurate assessment of the representativeness of the samples collected. In this example, producers submit 3 kilograms of wheat per 1,000 tonnes for each of the main varieties they produce. The Australian Export Grains Innovation Centre’s online results system provides producers with a direct year-to-year comparison (for producers who participate on an annual basis) and a comparison of their results against those of the regional and the national composites. In the Harvest Sample Program’s current design, producers are able to achieve this, but would be required to track their own results year over year and would need to seek out the crop quality reports on the Canadian Grain Commission’s website. The results of the producer survey indicate that a very small minority of participating producers are aware of this option and actually compare against regional and national results.
Effectiveness of the program’s designs and delivery for the needs of the Canadian Grain Commission
Interviews with Canadian Grain Commission representatives and program documents show that the design and delivery of the Harvest Sample Program is effective in meeting the needs of the Canadian Grain Commission. The current methodology provides the Quality Assurance Program and Grain Quality Research Program with an adequate supply of sample materials to support their activities and objectives. The delivery of the program could be enhanced by increasing producer registration and developing a means of more strategically targeting sample submissions to ensure statistically sound representation of growing regions and commodities. To enhance the design and delivery of the program, representatives suggested developing a system to send automated emails and notifications to producers. For example, producers could be sent a notification to remind them to submit their samples or to indicate their results are ready, or could receive their results via email. The program could also be enhanced by targeting specific under represented regions.
Current processes for tracking and reporting the performance of the program are largely sufficient to support internal decision-making, but could be enhanced by monitoring the acreage and tonnage of the samples submitted, and by tracking the number of producers culled from, and added to, the program producer database each year.
Effectiveness of the program’s design and delivery for the needs of producers
Surveys with participating producers demonstrate that the Harvest Sample Program is very effective overall in addressing their needs. A large majority of producers are satisfied or very satisfied with the services and information they receive (87%) and find the information provided relevant and useful (85%). This is significantly higher than the findings of the 2010 Ipsos Reid satisfaction survey, which indicated that 59% of producers who used Canadian Grain Commission grain grading services during the past three 3 years were satisfied or very satisfiedFootnote29. Almost all agree or strongly agree the envelopes arrive in a timely manner and the November 1 deadline affords them sufficient time to submit their samples (94%), and that it is easy for them to submit their grain samples (96%). While most (84%) find it easy to access their results, some producers reported difficulties logging into the Harvest Sample Program system or obtaining their results over the phone. Producers who lost their program kit number expressed frustration at not being able to log in via email, or speak with a representative to recover their information. Some producers also appeared to not understand how the results are distributed, as they expected their results to be sent via email or mail.
For most producers (80%) it is important or very important that the unofficial grade, dockage and quality assessment provided by the program continues to be offered at no additional cost to participants. Almost half (45%) of participating producers would likely not participate if the program were a fee-based service, and 28% suggested it would be somewhat likely they would continue. Only 13% of surveyed producers pay for an alternative grade and quality assessment, and these individuals most commonly do so because they require more technical factors that are not included in the Harvest Sample Program unofficial grade and assessment.
When asked how the delivery of the Harvest Sample Program could be enhanced, the most frequently noted recommendations of the producers surveyed are as follows.
Increase the responsiveness of the online interface and telephone system
Approximately 21% of producers surveyed requested that the Canadian Grain Commission email the results or a notification that the results are ready, or mail the results to those who request it. A few producers requested that the Canadian Grain Commission resolve issues with the online system or automated voicemail system, citing difficulties retrieving the pin/login number and updating their sample preferences. Some producers also indicated that a more professional, printable format of the unofficial grade and quality assessment could further enhance its utility as a marketing tool.
Include additional quality factors in the unofficial grade and assessment
Almost one third (29%) of producers surveyed suggested the program would be enhanced by the inclusion of a more detailed explanation of the downgrading factors and the inclusion of falling number, dockage, moisture, hard vitreous kernels, bushel weight, fusarium and vomitoxin. A few producers noted that it would be beneficial if the program included the same grading factors as elevators or buyers in the United States, explaining that differences in the grading systems make it very difficult for them to use the Harvest Sample Program unofficial grade as a benchmark for comparison.
Provide additional sample envelopes
Another recommendation was to allow larger producers and producers who grow multiple varietals of a single commodity to submit more than 8 sample envelopes and provide producers with greater flexibility to determine which samples they choose to submit (9%).
Other suggestions included making Harvest Sample Program grades official (6%) and reducing the turnaround time so the results are more beneficial in assisting producers with marketing (6%).
Producers who registered for the program but never submitted samples most frequently suggested:
- extending the deadline to the end of November to accommodate a late harvest (27%)
- allowing producers to submit more than 8 envelopes (18%)
- expanding the scope of testing (e.g. testing for oats, winter spelt, germination, and disease) (18%)
- improving accessibility of the results (18%)
Effectiveness of the program’s design and delivery for the needs of external beneficiaries
A large majority of external beneficiaries are satisfied with the services and information they receive from the Harvest Sample Program (100% of producer and industry associations, 100% of international buyers and 77% of domestic grain companies and buyers). All associations and international buyers, and 77% of the grain companies reported that the content of the harvest quality reports is relevant to their needs.
The format and delivery of the harvest quality reports and information is suited to the needs of producer and industry associations and grain buyers (75% of associations and 69% of grain companies). International buyers most frequently access the Canadian Grain Commission’s annual quality reports during Team Canada new crop missions (87%) or from the Canadian Grain Commission’s website (67%). A few international buyers noted that they are provided the information by grain sellers or brokers or other intermediaries. Most international buyers prefer to obtain the information in-person, suggesting they find it to be more educational, the presentations typically include more detailed information, and the ability to ask questions of the scientists enables them to understand the technical data. Some international buyers reported that the website is convenient and they appreciate the updates, but would benefit from a more standardized regular updating of the material or distribution of the updates via email to ensure they do not miss the information.
The timing of the Canadian Grain Commission’s annual quality reports is better suited to the needs of international buyers and processors than domestic stakeholders. Three-quarters of international buyers and processors (75%) stated that the reports are released in a timely manner based on their needs, as compared to almost half (46%) of the domestic grain companies and buyers. Approximately 40% of domestic grain companies and buyers and 38% of producer and industry associations report that they would prefer to see the reports published earlier. Producer and industry associations suggested that, to ensure the reports are accurate and reflect all of the harvest, the Canadian Grain Commission could release a preliminary report first and then follow-up with updates and the release of a second and final report. Due to the nature of the sampling methodology, it may not be possible to publish the reports early enough to inform domestic stakeholders’ marketing strategies. As domestic stakeholders primarily rely on their own sampling and analysis to inform their marketing strategies, and use the Canadian Grain Commission’s reports to obtain a good understanding of the national supply and the quality attributes of the crop year and to compare data across years and regions, this does not pose a significant problem for industry.
Expanding and diversifying the sample collection for the Harvest Sample Program (e.g. through partnerships with producer associations such as Western Wheat Growers, Pulse Canada, and the Canadian Canola Growers Association) or modifying the program methodology and scope (e.g. by releasing information on feed barley for export purposes, having more targeted and specific sampling, etc.) would also help the program to be more relevant to the needs of producer and industry associations and grain companies and buyers. To achieve this, producer and industry associations (38%) and grain companies (30%) suggested there should be greater awareness and promotion of the Canadian Grain Commission reports and information to encourage producer uptake and distribution of the reports. Grain companies noted increased awareness and promotion is needed among domestic stakeholders such as producers. Representatives from the producer and industry associations and grain buyers also believe more efforts should be made to ensure the Harvest Sample Program results are more accessible to their members and other stakeholders. Representatives suggested offering hard copies of the harvest quality reports, or emailing results and copies of the reports directly to producers, producer and industry associations, and grain companies.
International buyers suggested the Harvest Sample Program and the Canadian Grain Commission’s annual harvest quality reports and information could be enhanced through:
- better collaboration between Cigi and the Canadian Grain Commission
- the introduction of a notification system for when new information is posted or grading standards are revised
- the inclusion of a whole wheat loaf bake test
- more information on varietal specific performance and end use functionality
"Page details"
- Date modified: