
Historical protein content for Canada Western Amber Durum wheat
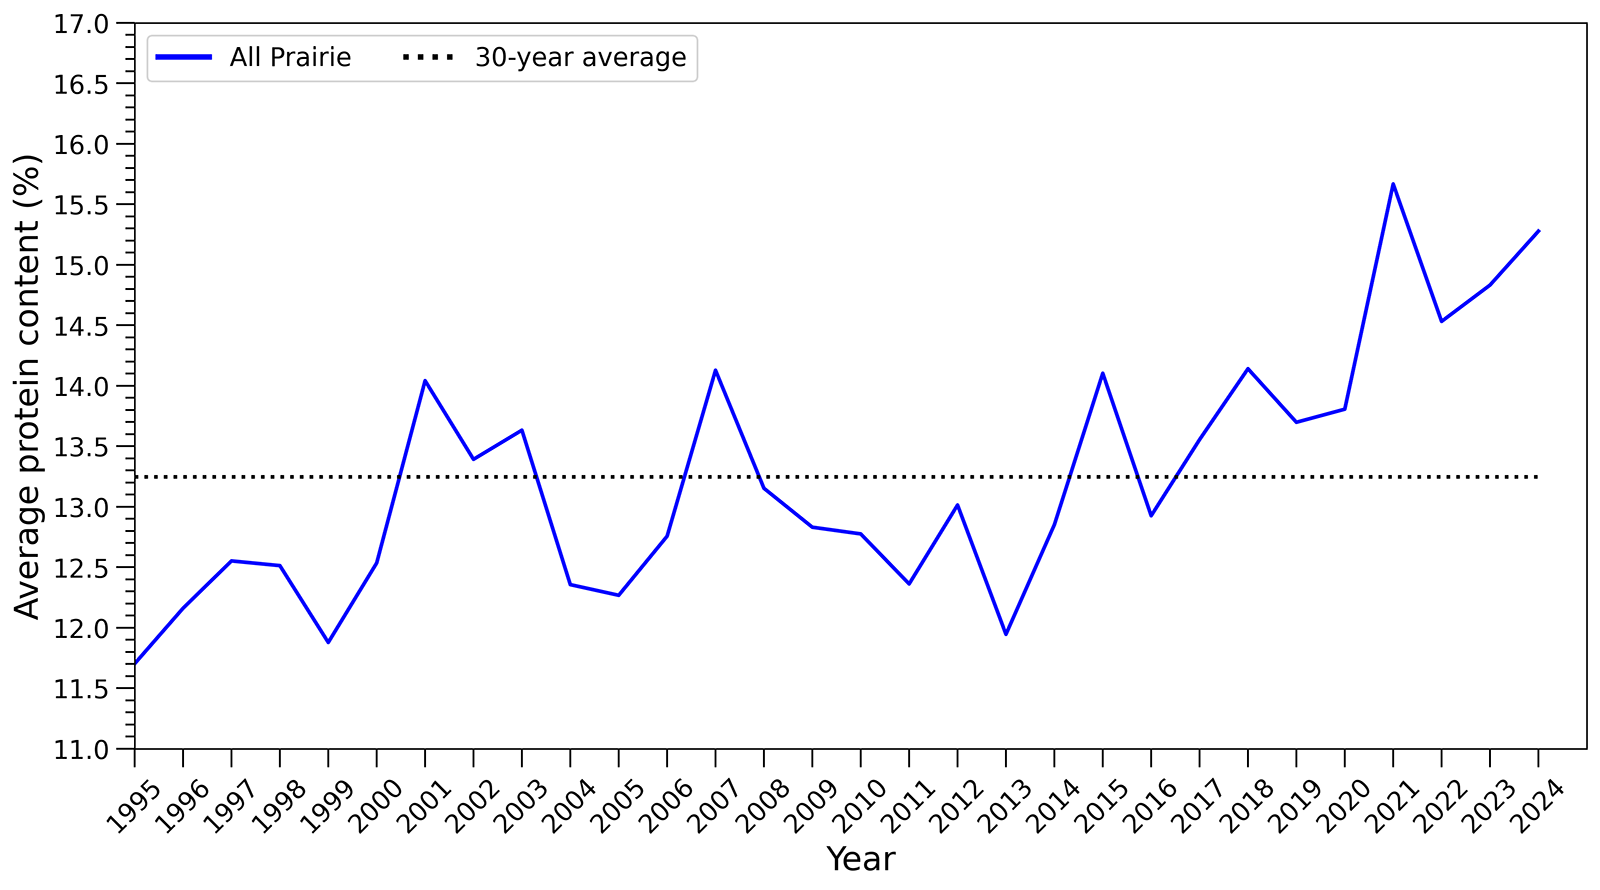
This report presents historical data on protein content for Canada Western Amber Durum (CWAD) wheat grown from 1995 to 2024. Wheat samples were submitted to the Canadian Grain Commission’s Harvest Sample Program by producers. Quality data is compiled from the results of analytical tests performed in the Grain Research Laboratory.
Graph data
| Year | All Prairie |
|---|---|
| 1995 | 11.7 |
| 1996 | 12.2 |
| 1997 | 12.6 |
| 1998 | 12.5 |
| 1999 | 11.9 |
| 2000 | 12.5 |
| 2001 | 14.0 |
| 2002 | 13.4 |
| 2003 | 13.6 |
| 2004 | 12.4 |
| 2005 | 12.3 |
| 2006 | 12.8 |
| 2007 | 14.1 |
| 2008 | 13.2 |
| 2009 | 12.8 |
| 2010 | 12.8 |
| 2011 | 12.4 |
| 2012 | 13.0 |
| 2013 | 11.9 |
| 2014 | 12.9 |
| 2015 | 14.1 |
| 2016 | 12.9 |
| 2017 | 13.6 |
| 2018 | 14.1 |
| 2019 | 13.7 |
| 2020 | 13.8 |
| 2021 | 15.7 |
| 2022 | 14.5 |
| 2023 | 14.8 |
| 2024 | 15.3 |
| 30-year average | 13.2 |
"Page details"
- Date modified: